Check out the updated Build your own budget interactive analysis tool for a more comprehensive view of overall impacts.
The interactive analysis tool allows users to test various policy and parameter changes to see the impact on the Australian Government budget.
The modelling in Build your own budget underpins the projections and analysis contained in this report and users can replicate the scenario analysis contained in this report for a more comprehensive view of overall impacts.
Overview
The 2025-26 Medium-Term Budget Outlook: Beyond the Budget presents the 10th edition of the Parliamentary Budget Office’s (PBO’s) independent projections for the Australian Government’s fiscal position and budget sustainability across the medium term to 2035-36. It also updates our analysis of long-term fiscal sustainability to 2068-69.
Despite projections for most fiscal aggregates slightly deteriorating compared to a year ago, in most of our long-term fiscal scenarios the debt-to-GDP ratio continues to improve. This indicates that the budget remains sustainable, provided future governments continue to manage finances in a manner consistent with those of the past.
This does not lessen the difficulty of future decision-making. On the revenue side of the budget, there is a structural intergenerational challenge and, absent policy change, this is likely to be exacerbated over the medium term. Notwithstanding the tax cuts announced in the 2025‑26 Budget, there is a continued risk of increased dependence on personal income tax driving the intergenerational challenge as well as raising issues around equity and efficiency of the tax-base more broadly. Additionally, the fuel, alcohol and tobacco-reliant excise tax base will continue to shrink as a share of GDP in the absence of policy change.
Bracket creep has historically played a central role in budget repair, but future governments may find it harder to continue to offer regular income tax cuts while maintaining budget sustainability as a result of both pressures on the revenue and expense side of the budget.
On the expenditure side, long-term structural pressures persist, particularly from Australia’s ageing population, rising costs of health care and disability support. This, combined with pressure on increasing defence spending, interest costs, and likely future costs from policies to tackle climate change will continue to put pressure on expenditure. While growth in the National Disability Insurance Scheme (NDIS) appears to have moderated sightly, further moderation will be required to make this program sustainable.
As always, a sustainable future fiscal position will need to be underpinned by productivity growth that drives the economy, generating sufficient tax revenue to broadly keep pace with government spending. Productivity growth is slowing across the globe, and the budget assumption of 1.2% yearly growth is higher than recent history in Australia. Should this productivity growth not be achieved, lowering government debt over the medium term becomes more difficult.
Future policies in tax and spending programs will need to support productivity. The design of spending programs will need to be done in a way so as to avoid the kind of rapid growth seen in the NDIS. On the other side of the ledger, revenue will need to be raised with an awareness of its impact on productivity and growth.
While the economic assumptions effectively allow for a business cycle, if future economic shocks are greater than those of the past, the budget will need to build larger buffers during periods of growth.
Like most budgets over the past 20 years, there are no tax cuts assumed beyond those already announced. The cost of the public service is assumed to decline by over half a per cent of GDP over the forward estimates ($17 billion in 2028-29), on the basis that there will be no new spending beyond that which has been publicly announced.
Similarly, spending on many grant programs are also assumed to decline significantly through the forward estimates period as a share of GDP. Assumed declines of this size are common in budget projections but they have never eventuated due to governments later announcing new programs or extensions to terminating programs.
These long-standing assumptions mean that the budget continues to understate expenses. Following historical patterns, expenses may be understated by up to 1.5% of GDP by 2028-29 and up to 3% of GDP in a decade. If this is the case, budget deficits and higher levels of government debt will continue through the medium term and beyond, with large policy adjustments required to restore fiscal sustainability.
This 10th edition of Medium-Term Budget Outlook: Beyond the Budget includes discussion around the increasing use of ‘off‑budget’ spending and takes a look back 10 years to see how actual revenue and expenditure compared to the projections from 2015-16.
Data for all charts and tables in this report are also available from our Data portal. If you find this report useful or have suggestions for improvement, please provide feedback to feedback@pbo.gov.au.
1 How to read this report
The 2025-26 Medium-Term Budget Outlook: Beyond the Budget presents the PBO’s independent projections for the Australian Government’s balance sheet, major fiscal aggregates, and revenue and expense categories. It also includes our assessment of the budget’s long-term fiscal sustainability to 2068-69.
The PBO’s legislation requires us to use the latest fiscal forecasts, policy settings and economic assumptions which were presented in the Australian Government's 2025-26 Budget, published on 25 March 2025. Accordingly, the fiscal estimates shown in Beyond the budget for the 4-year ‘forward estimates’ period, 2025-26 to 2028-29, are identical to the budget. Our independently modelled fiscal projections are for the ‘medium term’, which refers to the period from 2029-30 to 2035-36 (reaching out to a decade from the budget year). Our projections are based on the same economic assumptions that underpin the budget.
Beyond the budget aims to:
- Provide analysis of modelled trajectories of fiscal aggregates over the next decade. The PBO’s projections are generated using our Build your own budget analysis tool, for which Beyond the budget is the companion report. Our results are at times compared to the previous Beyond the budget, released in June 2024 and based on the 2024-25 Budget.
- Discuss key fiscal risks and challenges for the next decade, including through scenario analysis of how the fiscal position would alter if different assumptions were applied. The PBO’s Build your own budget tool allows you to explore alternatives to the analysis we present here by adjusting various policy and economic parameters.
- Provide medium-term fiscal projections at a greater level of detail than is available in the published budget papers. The PBO's projections cover each of the major taxes and expense programs to enable more detailed analysis of the factors influencing the budget over the next decade.
- Present an analysis of fiscal sustainability for the period after the end of the medium term (from 2036-37 onwards). While the projections to 2035-36 relate directly to the economic projections of the 2025-26 Budget, the longer-term fiscal analysis explores the question: ‘If governments maintain budget balances that are similar to historical precedents across economic cycles (even if this budget balance is a deficit), is the fiscal position likely to be sustainable across the long term?’ To answer this, we focus on potential pathways for the gross debt-to-GDP ratio from 2036-37 to 2068-69, based on combinations of 3 key parameters: the budget primary cash balance (headline cash balance (HCB) before interest payments), interest rates, and economic growth (nominal GDP).
As our framework for fiscal sustainability centres on the balance sheet, we present our medium term outlook for the balance sheet and major aggregates first (chapter 2), followed by fiscal sustainability scenarios (chapter 3) and challenges for fiscal sustainability (chapter 4). More detail on government revenue and expenses across the medium term is presented in chapters 5 and 6. This 10th edition of Medium-Term Budget Outlook: Beyond the Budget includes an examination of how the current budget position compares to that presented in the first edition 2015-16 Budget: medium-term projections, published in June 2015 (chapter 7). Our methodology is summarised in Appendix A.
To support further analysis of this report, the charts are available in the online version and all the underlying data series for all charts and tables are available in our Data portal.
Note on terminology in this report
This report uses comparative adjectives to describe how amounts change over time or between forecast periods. While comparative terms such as ‘higher’ and ‘lower’ are straightforward when referring to positive amounts, they can be misleading or ambiguous when applied to negative values. For example, if the UCB changes from -$10 billion to -$5 billion over a given period (i.e., becomes a smaller negative amount), has the UCB increased or decreased?
In these cases, the report uses terms which aim to avoid ambiguity and make the text more readable but inevitably add value judgements and may appear pejorative. In the example, we would say that the UCB ‘improves’. For the reverse case, we say that the UCB ‘deteriorates’.
As a general rule, we use positive terms for cases which effectively reduce public debt and negative terms for cases which effectively increase public debt.
In using these terms, we acknowledge that ‘improving’ the UCB may not always be the most effective fiscal strategy and that policy which ‘deteriorates’ the UCB, or ‘worsens’ the debt position, may sometimes be advisable. Making the budget ‘worse’ is not always bad.
Box 1: What is the Parliamentary Budget Office (PBO)?
The PBO was established in 2012 to inform the Parliament by providing independent and non-partisan analysis of the budget cycle, fiscal policy and the financial implications of proposals' (Section 64B of the Parliamentary Service Act 1999). We do this in 3 main ways:
- by responding to requests made by senators and members for costings of policy proposals or for analysis of matters relating to the budget
- by publishing a report after every election that provides transparency around the fiscal impact of the election commitments of major parties
- by conducting and publishing self-initiated work that enhances the public understanding of the budget and fiscal policy settings.
For further information and an introduction to our services, see Guide to the services of the Parliamentary Budget Office (PBO).
2 Fiscal projections
- This chapter presents the medium‑term projections for the balance sheet and major fiscal aggregates, based on the economic projections of the 2025‑26 Budget.
- Projections for most fiscal aggregates, such as the budget balance and debt, have slightly deteriorated compared to a year ago.
- Gross debt is projected to fall from 35.5% of GDP in 2025‑26 to 31.8% of GDP in 2035‑36, despite continued budget deficits.
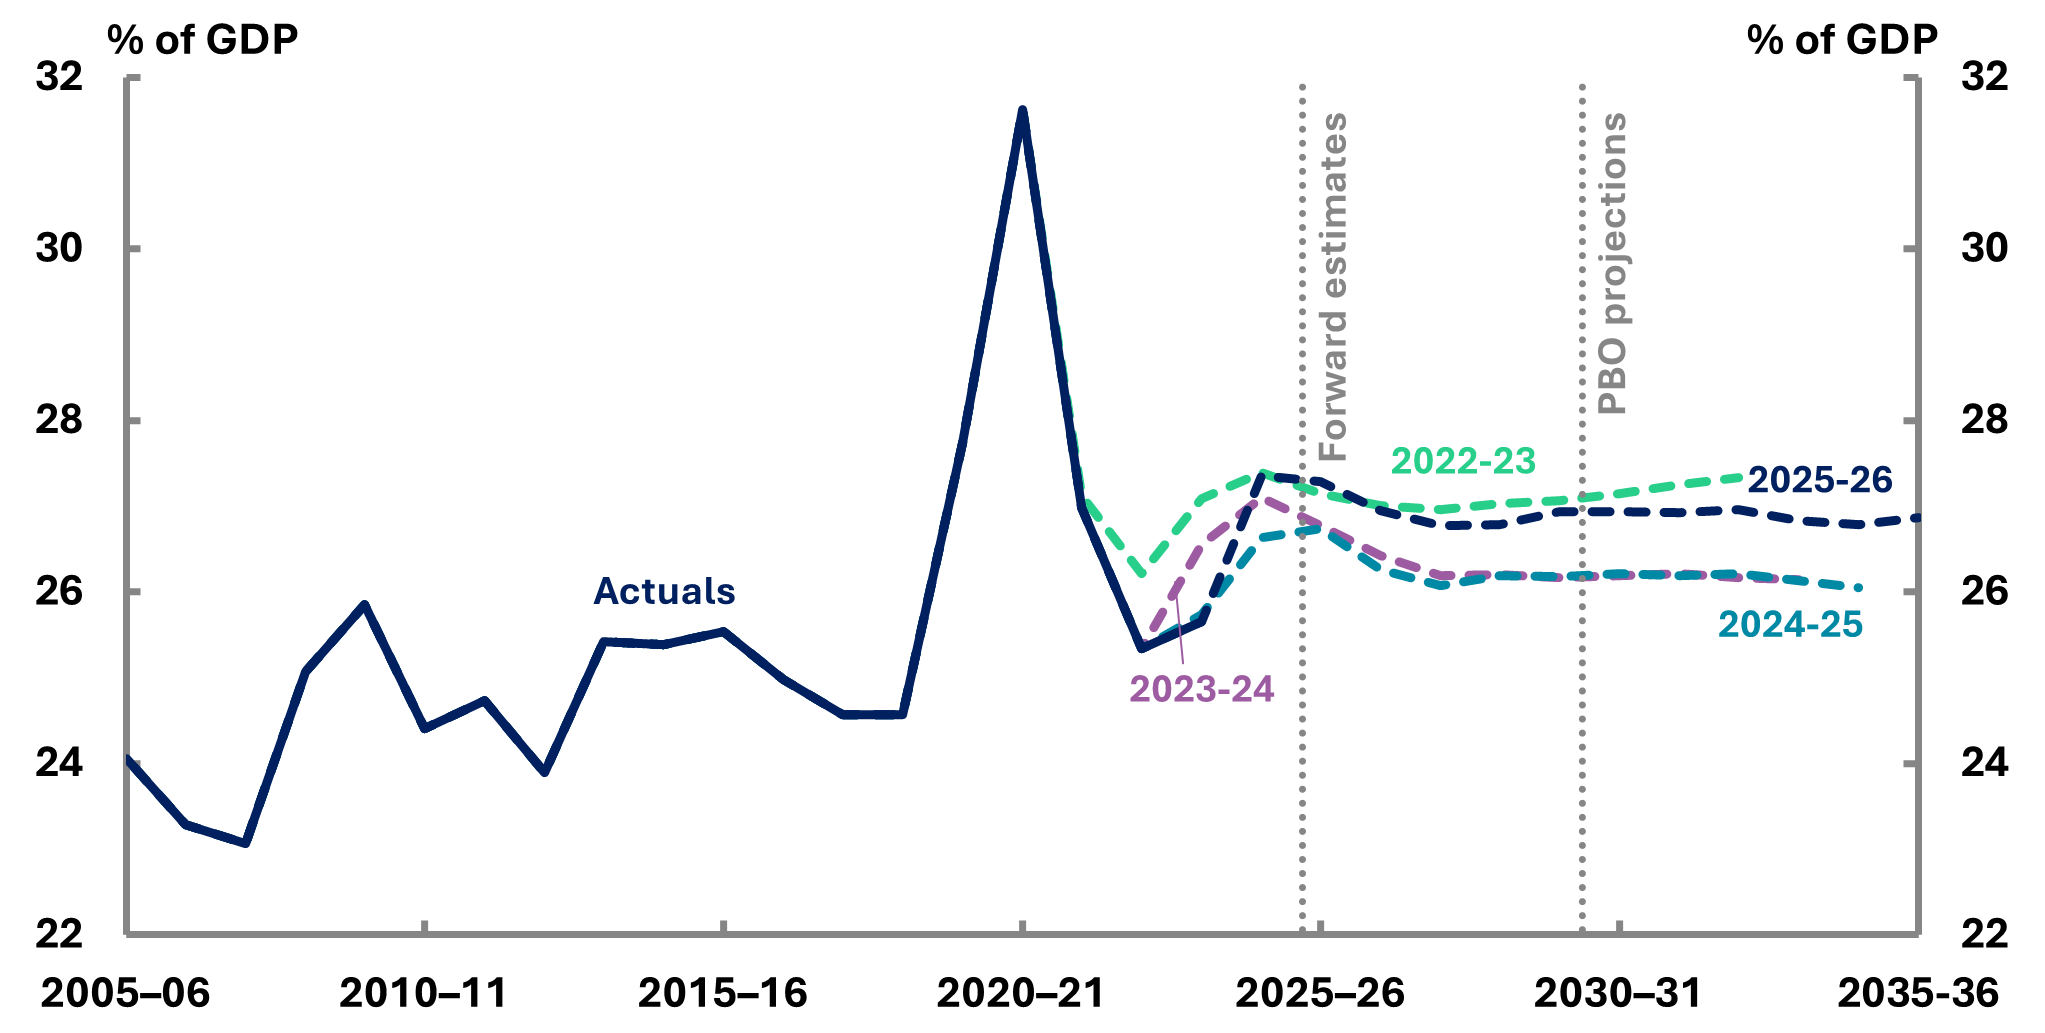
- The UCB is projected to gradually improve from a deficit of 1.5% of GDP in 2025‑26 to a deficit of 0.1% of GDP in 2035‑36.
Compared to the 2023-24 and 2024-25 editions of Beyond the budget, the latest projection for gross debt as a share of GDP (Figure 2-1) is for a less favourable trajectory over both the forward estimates (to 2028-29) and the medium term (to 2035-36). However, compared to the pandemic period, when projections were more volatile, the current outlook is significantly improved and demonstrates greater stability, with debt as a share of GDP falling over the medium term.
The overall increase in debt as a share of GDP in 2025-26 is driven by upward revisions to spending. Several programs (NDIS, defence, interest expenses, aged care) cost more in 2024-25 than previously expected, increasing expectations for their costs in the future (Chapter 6). The spending increases are partly offset by a slight upward revision to revenue as a share of GDP (Chapter 5).
Figure 2-1: Gross debt, 1995-96 to 2035-36
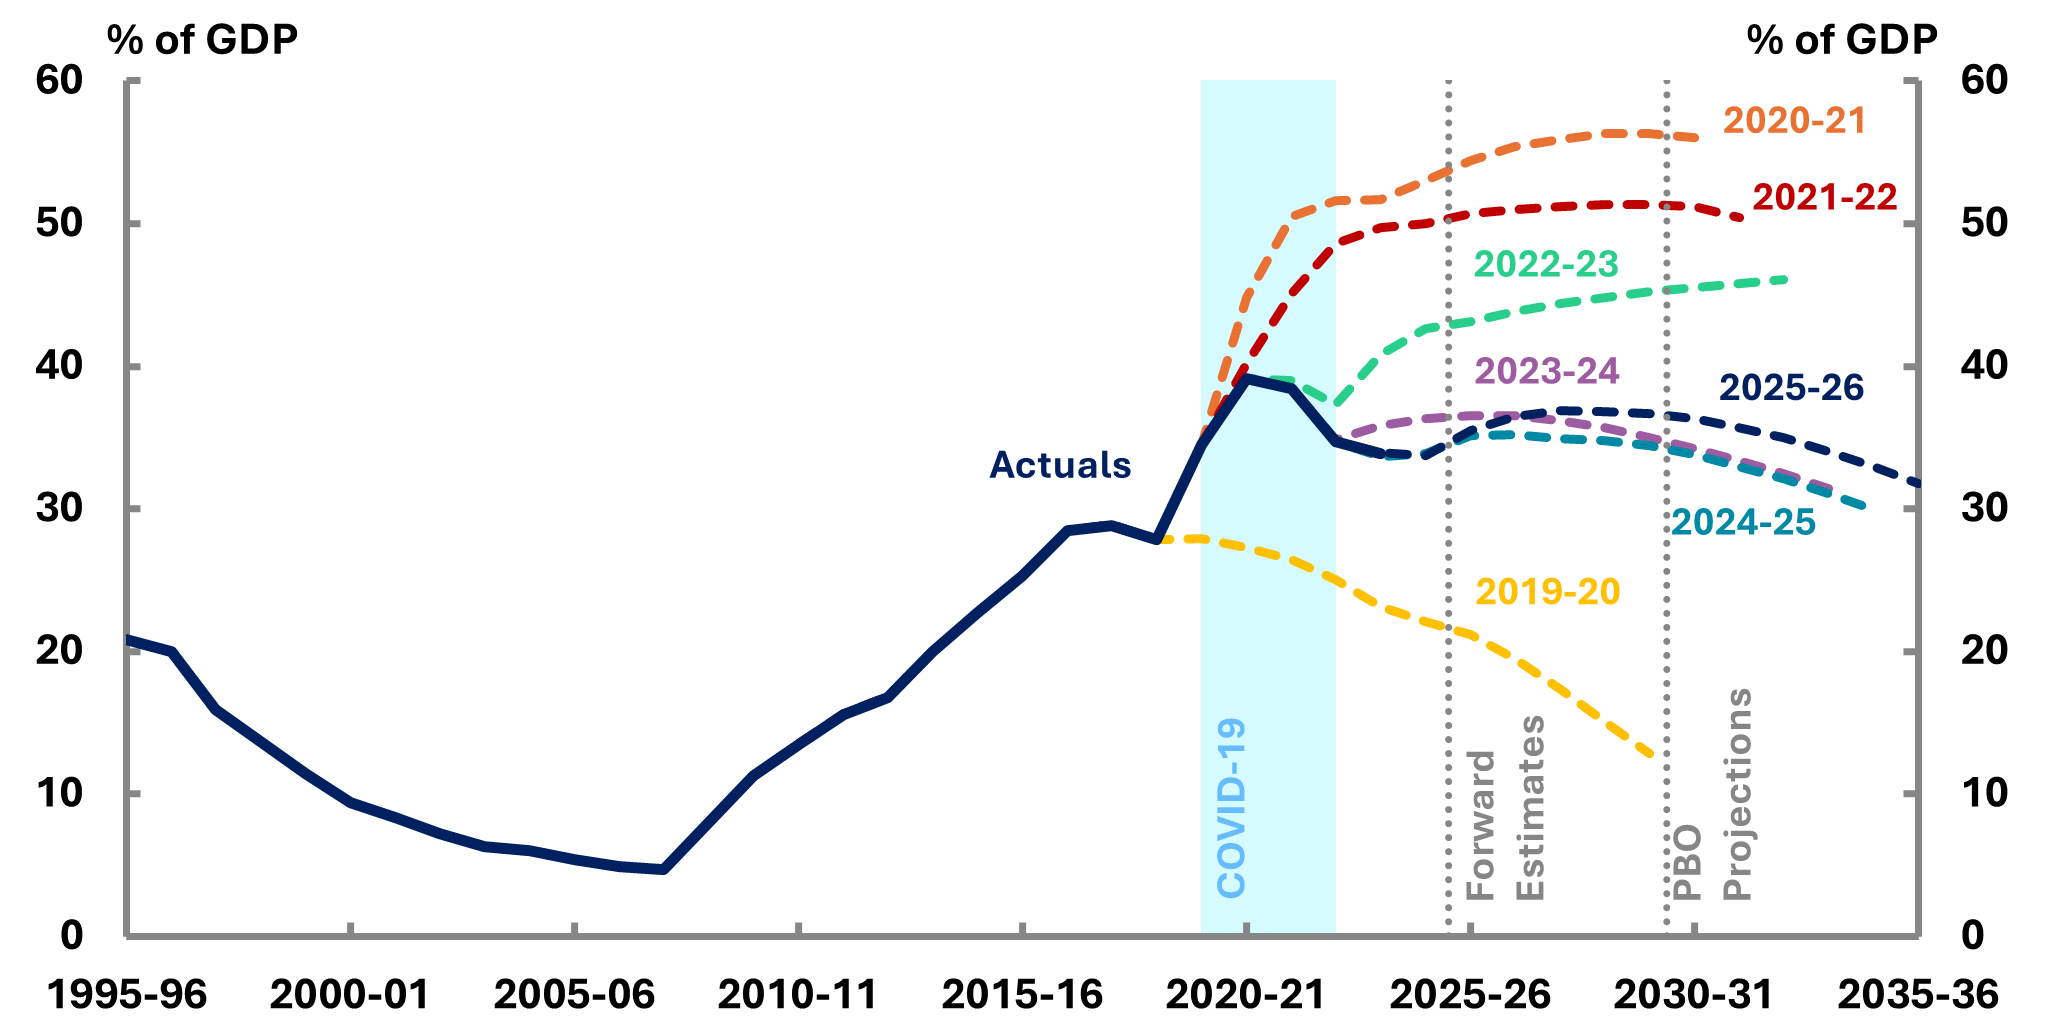
Source: 2022-23 Budget, 2023-24 Budget, 2024-25 Budget, 2025-26 Budget and PBO analysis.
These changes have not been large enough to change the overall trajectory of debt from a slow decrease over the medium term. However, only a relatively small reduction in revenue or increase in expenses could shift the trajectory to steadily increasing debt.
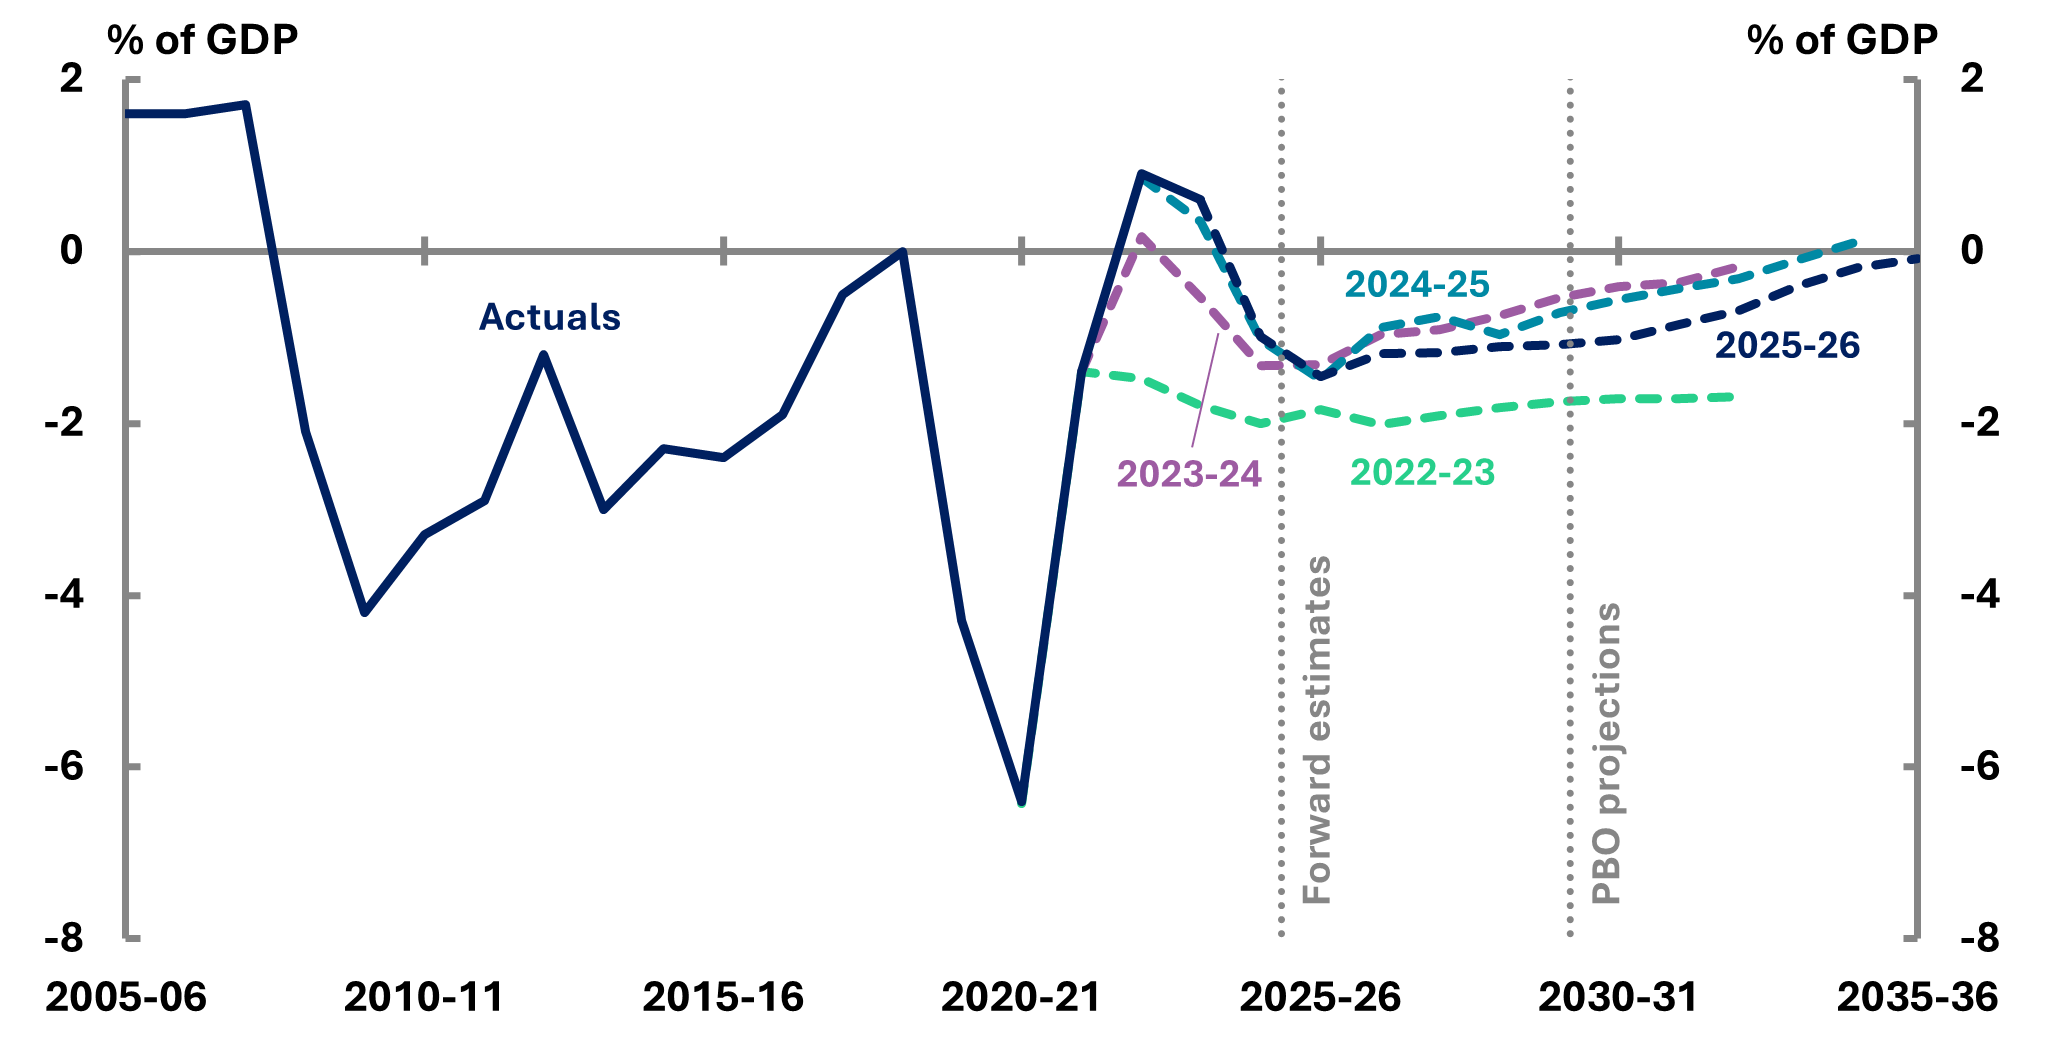
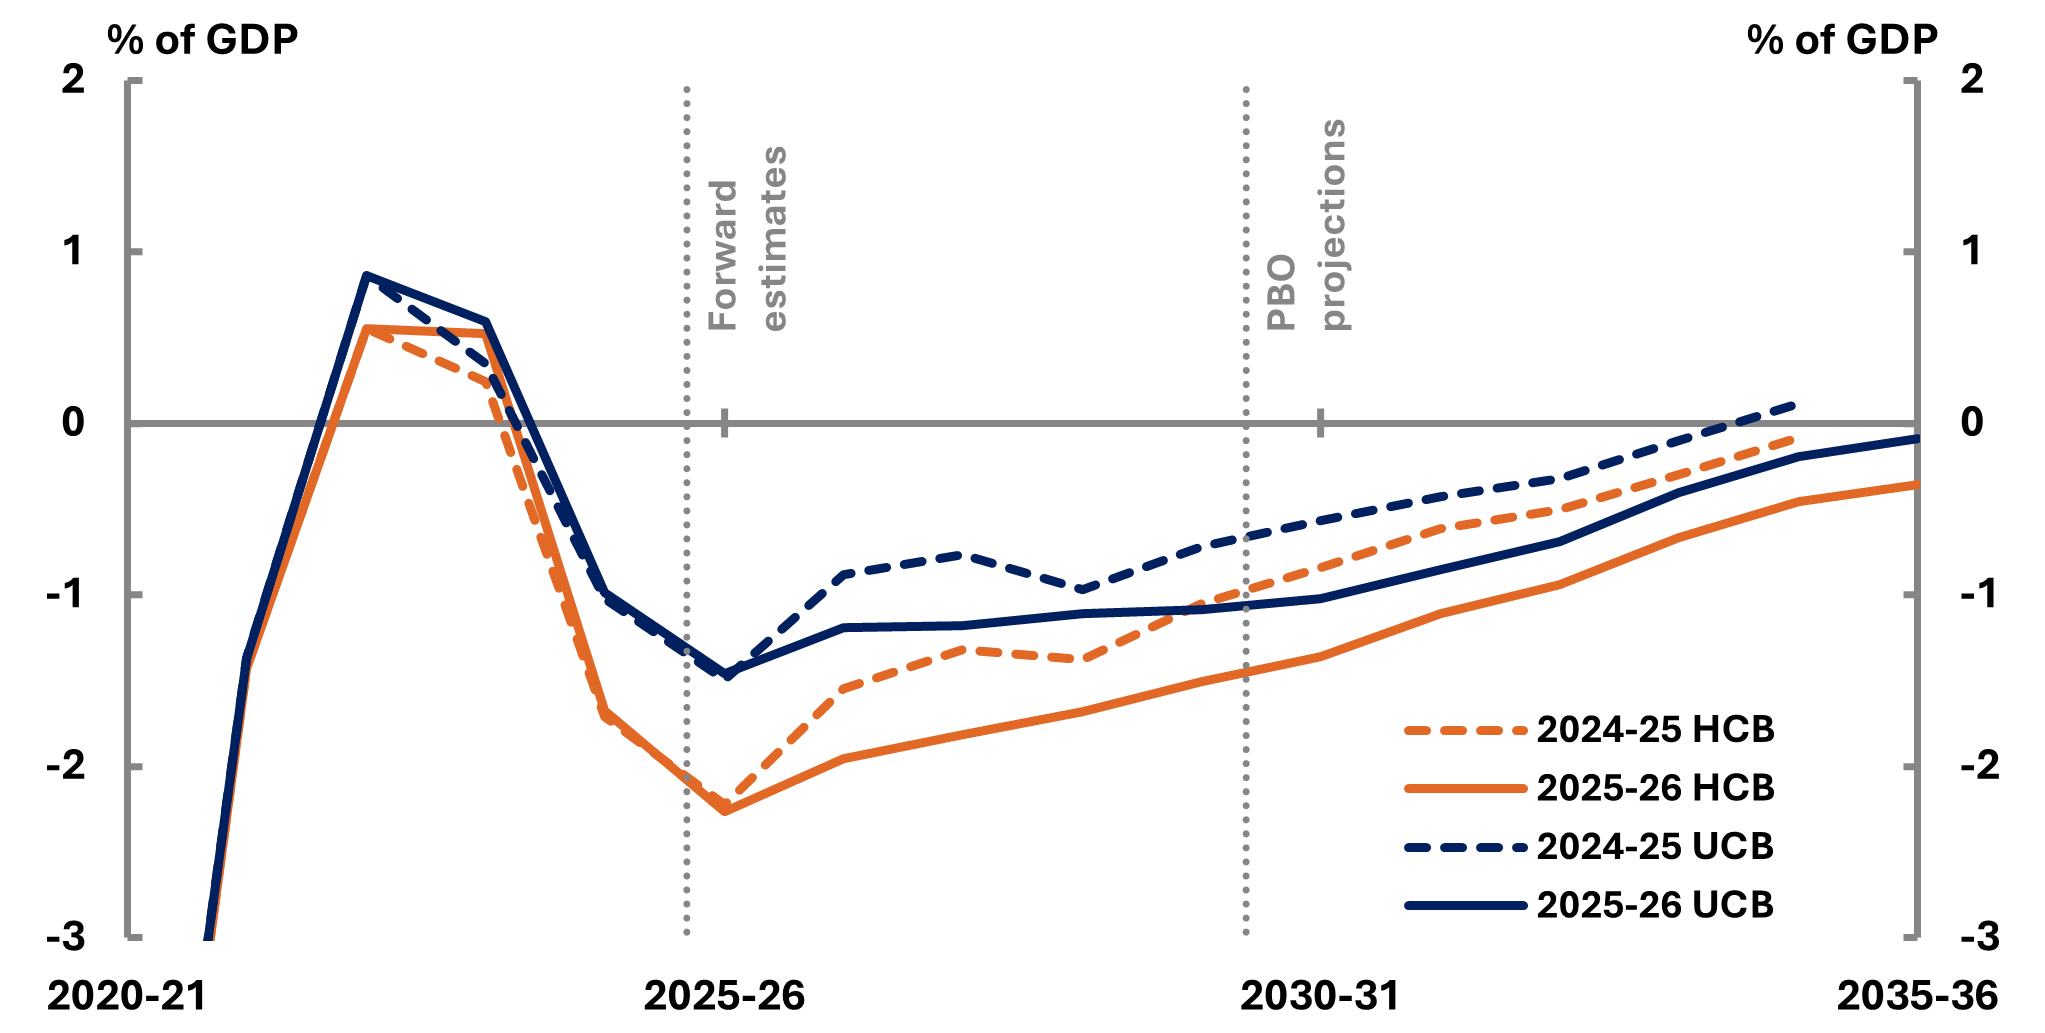
The 2025-26 Budget projections show a slight deterioration in the fiscal outlook compared to the previous 2 editions of Beyond the budget. Figure 2-2 shows a larger UCB deficit projected across the medium term compared to the previous 2 editions.
This deterioration is due to revisions to economic parameters and government policies. Expenses have been revised upwards and have not been fully offset by increases to revenue as a share of GDP, resulting in our projections of UCB showing a slower recovery and deeper deficits through the forward estimates and into the medium term.
Small revenue upgrades since last year’s projections are a result of better-than-expected labour market outcomes over the past year. Commodity prices also support revenue in the short term but are expected to moderate. These revenue increases have been partly offset by higher interest and operational costs,[1] as well as a range of new expenditure policy decisions (also known as 'measures').
Importantly, consistent with the 2025-26 Budget, these projections assume no further personal income tax cuts for the next decade.
More detail on revenue projections is contained in chapter 5, while further information on expenditure projections is contained in chapter 6. For more information on the change in the UCB since the 2024-25 Budget see Figure A-2.
Figure 2-2: Underlying cash balance, 2005-06 to 2035-36
Gross interest payments (Figure 2-3, left chart) are projected to rise gradually over the forward estimates and into the medium term, averaging 1.1% of GDP over the forward estimates and 1.5% of GDP over the remainder of the medium term. This increase reflects both the expected size of the gross debt stock and assumptions around interest rates.
Historically, gross interest as a share of GDP declined significantly from the mid-1990s to the late 2000s, reflecting falling debt levels and interest rates on government debt. Since the COVID-19 pandemic, interest costs have started rising again due to increased borrowing and higher interest rates.
Compared to the 2023-24 and 2024-25 editions of Beyond the budget, the 2025-26 projections for interest payments are slightly higher over the medium term, mainly driven by higher borrowing costs. This change reflects the impact of recent changes in monetary conditions. In line with the tightening of monetary policy globally, the Australian cash rate rose from 0.1% to 4.35% by late 2023 before easing to 4.1% by the time of the budget in March 2025. The cash rate currently sits at 3.6% (September 2025).
Similarly, 10-year government bond yields, which are driven by investor expectations for future economic growth and inflation,[2] climbed from 1% in 2021 to over 4% by 2023 and are projected to stay between 4.2% and 4.6% in the medium term. These higher rates significantly raise the cost of servicing both new and refinanced debt.
Figure 2-3 (right chart) shows how bond yield projections have changed in 2025-26 compared to the 2024-25 and 2023-24 projections. The increase in bond yields, combined with slightly higher projected debt, has driven the higher projections of interest payments in this report.
Figure 2-3: Gross interest (1995-96 to 2035-36), 10-year bond yields (2025-26 to 2035-36)
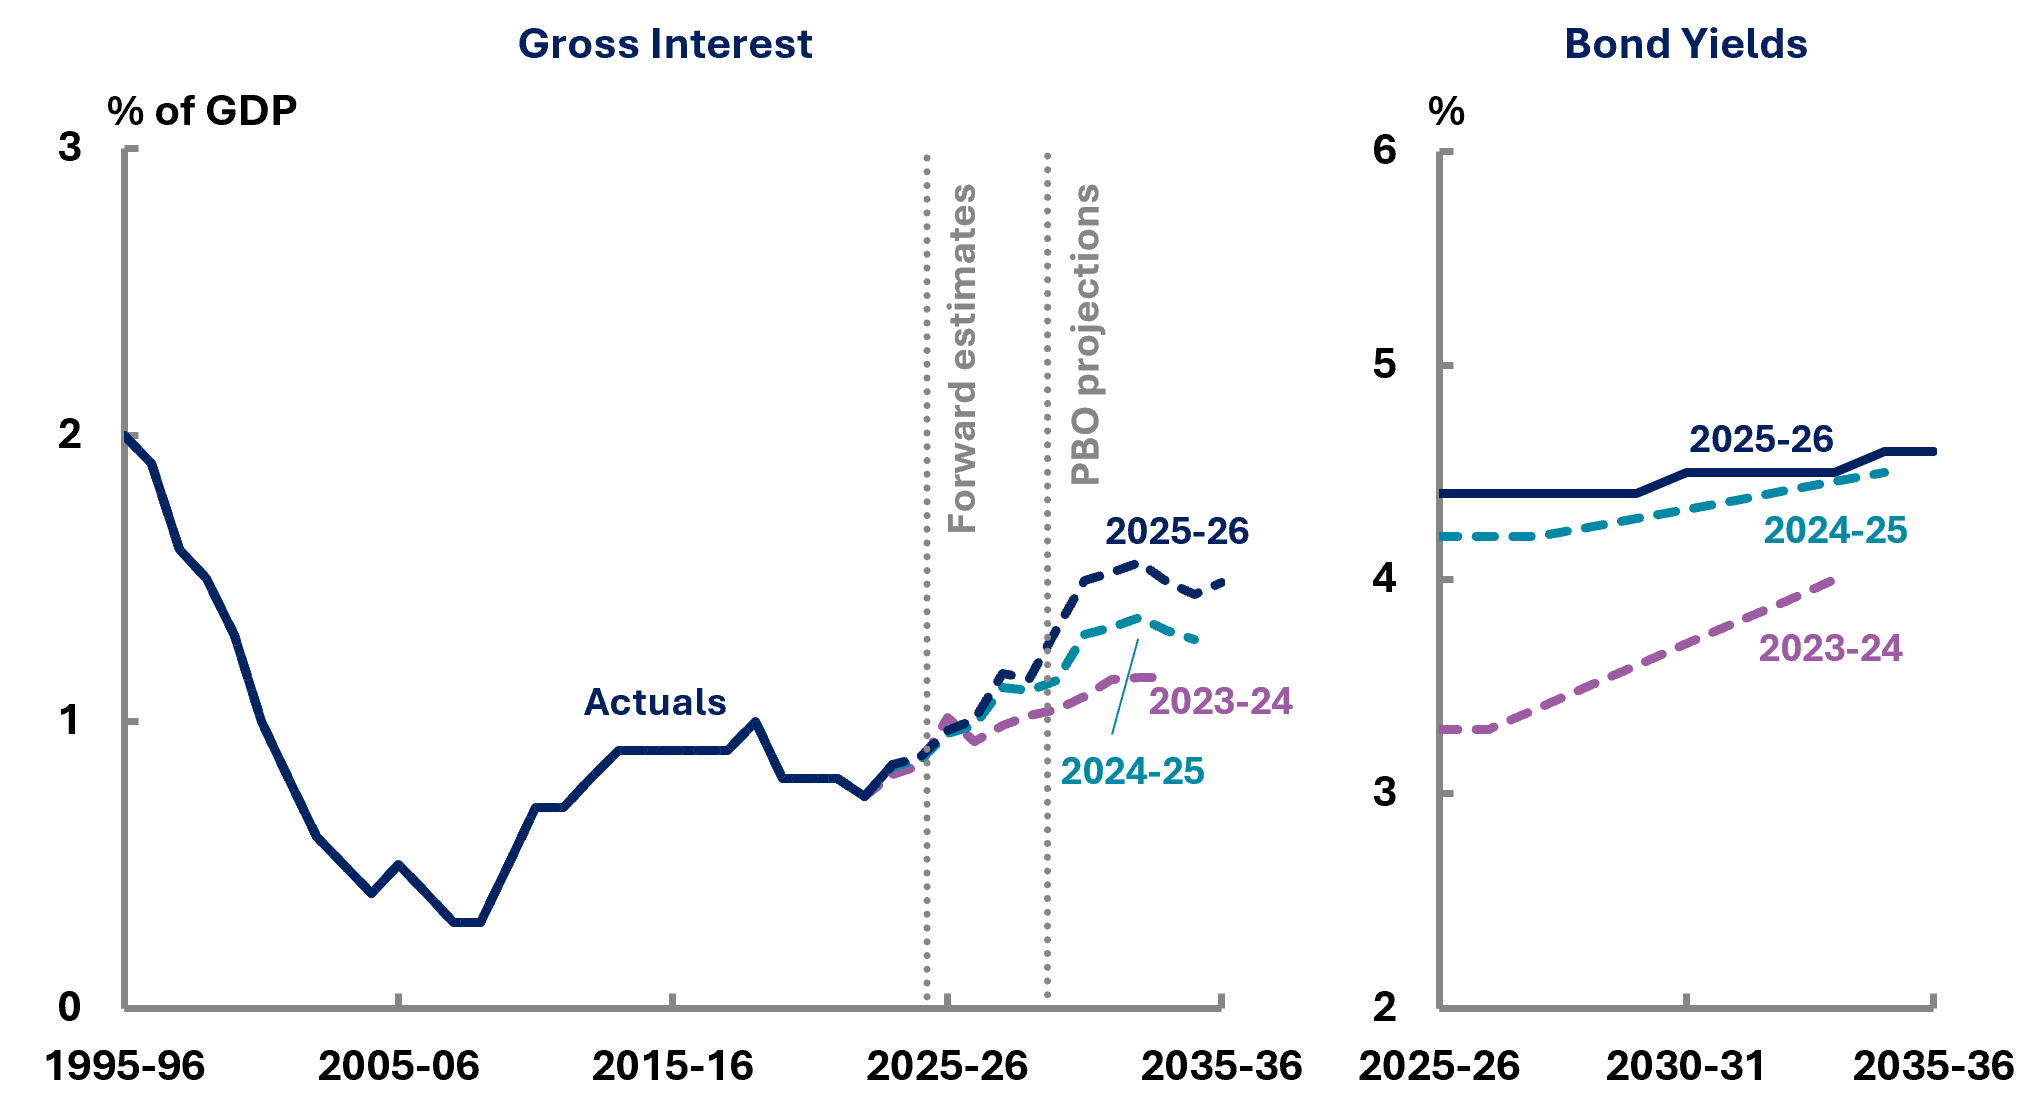
Source: 2023-24 Budget, 2024-25 Budget, 2025-26 Budget and PBO analysis.
The UCB is one of several ‘fiscal aggregates’ used to assess the budget position. As each aggregate has a different focus, it can be useful to examine different aggregates when assessing the budget position.
The primary cash balance (PCB), fiscal balance (FB), and HCB (see Appendix A for a description of these and other budget balances) are commonly used in conjunction with the UCB (Figure 2‑4).
Figure 2-4: 2025-26 Budget aggregates, 2020-21 to 2035-36
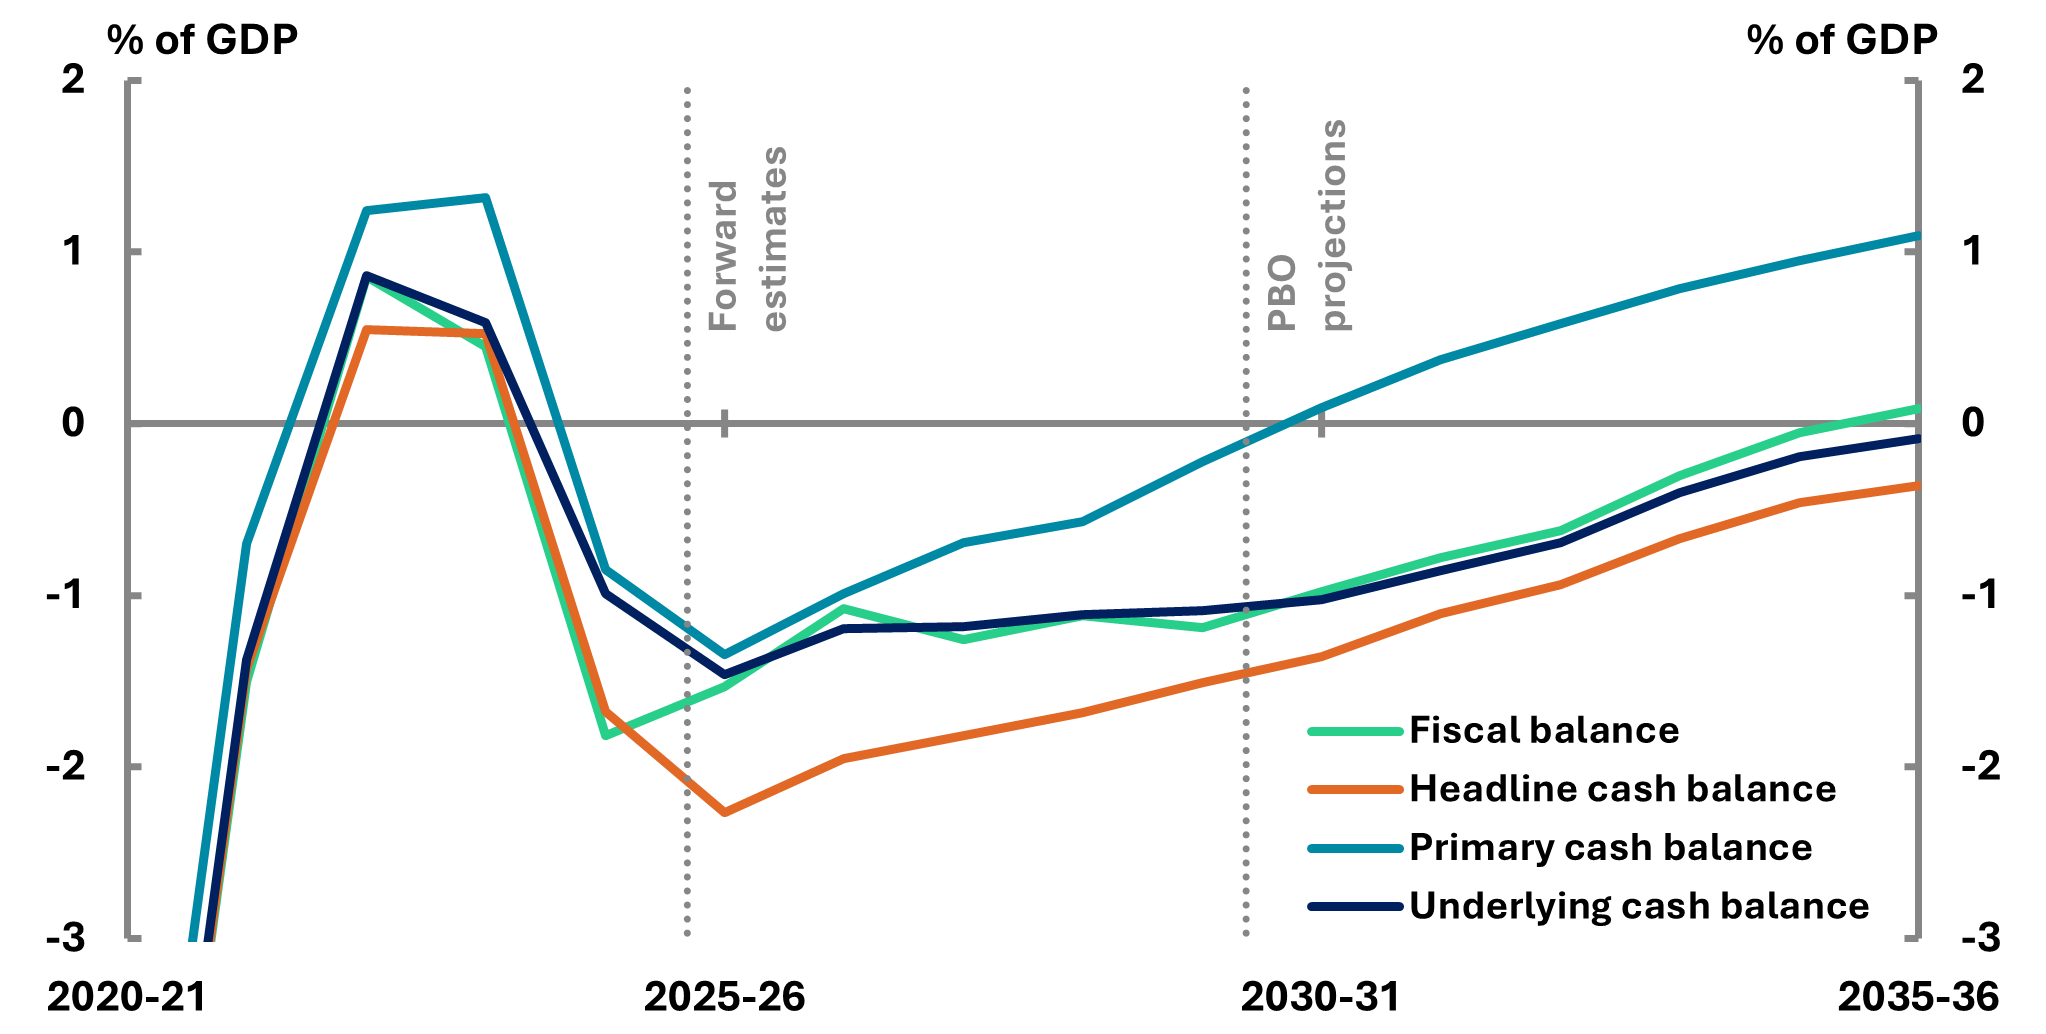
- The PCB excludes public debt interest (PDI) payments from the cash balance[3] and is expected to return to surplus in 2031-32, while the UCB is not expected to do so by 2035‑36.
- The difference between the PCB and UCB largely reflects the impact of debt servicing costs (PDI). These costs reflect the cumulative effects of past fiscal decisions on spending, revenue and borrowing to fund fiscal policy.
- While these decisions were often made in response to economic shocks or policy priorities at the time, their legacy is evident in the ongoing interest burden carried forward in the budget. As a result, even where the PCB indicates a consolidation to a surplus by 2031-32, the UCB remains in deficit for the remainder of the medium term as a result of the legacy spending.
- The FB is an accrual-based measure that captures revenues and expenses when they are incurred (not paid), including depreciation. We project the FB has a similar path to the UCB, but slightly better than the UCB trajectory (from 2030‑31) over the medium term. This is because accrual accounting recognises non-cash items like depreciation and capital use charges, which improve the FB relative to the cash-based UCB.
- Compared to the other measures, the HCB is projected to show the largest deficit across the medium term. This is mainly affected by policy-driven investments (e.g. NBN, the Clean Energy Finance Corporation’s energy transition fund, housing financial initiatives, and student loans).
- For further information on the policy-driven investment, see section 2‑5 – Evolving use of alternative financing arrangements.
Both the UCB and HCB trajectories in the 2025-26 projections are less favourable than those in the 2024-25 edition, with deficits getting worse (Figure 2-5). This deterioration reflects increased government spending (including higher interest cost, Medicare Benefits Schedule (MBS) payments, schools funding and aged care), partially offset by higher revenue, reflecting upwards revisions to personal income tax and superannuation tax.
Figure 2-5: Underlying cash balance and headline cash balance, 2020-21 to 2035-36
Recent budgets show an increase in the use of 'alternative financing' arrangements, where the costs associated with the measures do not appear in the UCB.
Alternative financing arrangements can come in a number of forms. These cash flows mostly do not affect the government’s overall balance sheet position, since they are simply exchanging one asset (cash) for another.[4] The transactions are called ‘net cash flows from investments in financial assets for policy purposes’,[5] which together are the difference between the HCB and the UCB.
- In some cases a government program involves receipts or payments in exchange for an asset or liability. For example, the government provides funds for students’ tertiary education and in exchange receives an asset in the form of a loan. When students repay the loan, the government’s asset decreases in value.
- Similarly, when the government provided funds to the building of the NBN (an equity injection), it received the asset of shares in NBN Co Ltd.
A negative cash impact from investments over a given period indicates that the government has disbursed more funds through new investments or loans than it has received from the sale of investments or the repayment of loans.
The 2025-26 Budget included a number of measures involving alternative financing, for example:
- the recapitalisation of the Clean Energy Finance Corporation (CEFC),
- the Help to Buy program, and
- a 20% reduction in student loan debts.
Some items classified as ‘investments’ may not meet the traditional definition of an asset that generates future economic benefit. For example, the 20% reduction in student loan debts (a one‑off reduction removing over $16 billion in HELP and other student debt) announced in the 2025-26 Budget. The government writes down the value of the HELP loan asset on its balance sheet and a corresponding expense is recorded in the operating statement. This results in a significant expense in the year of the write-down. However, the measure reduces future expected repayments, affecting longer-term revenue forecasts.
While the initial costs of these programs do not directly affect the UCB, all these transactions are still part of the budget. They are typically disclosed in the HCB measure and the government’s financial statements in the Reconciliation of general government sector underlying and headline cash balance estimates table in Budget Paper No. 1.[6]
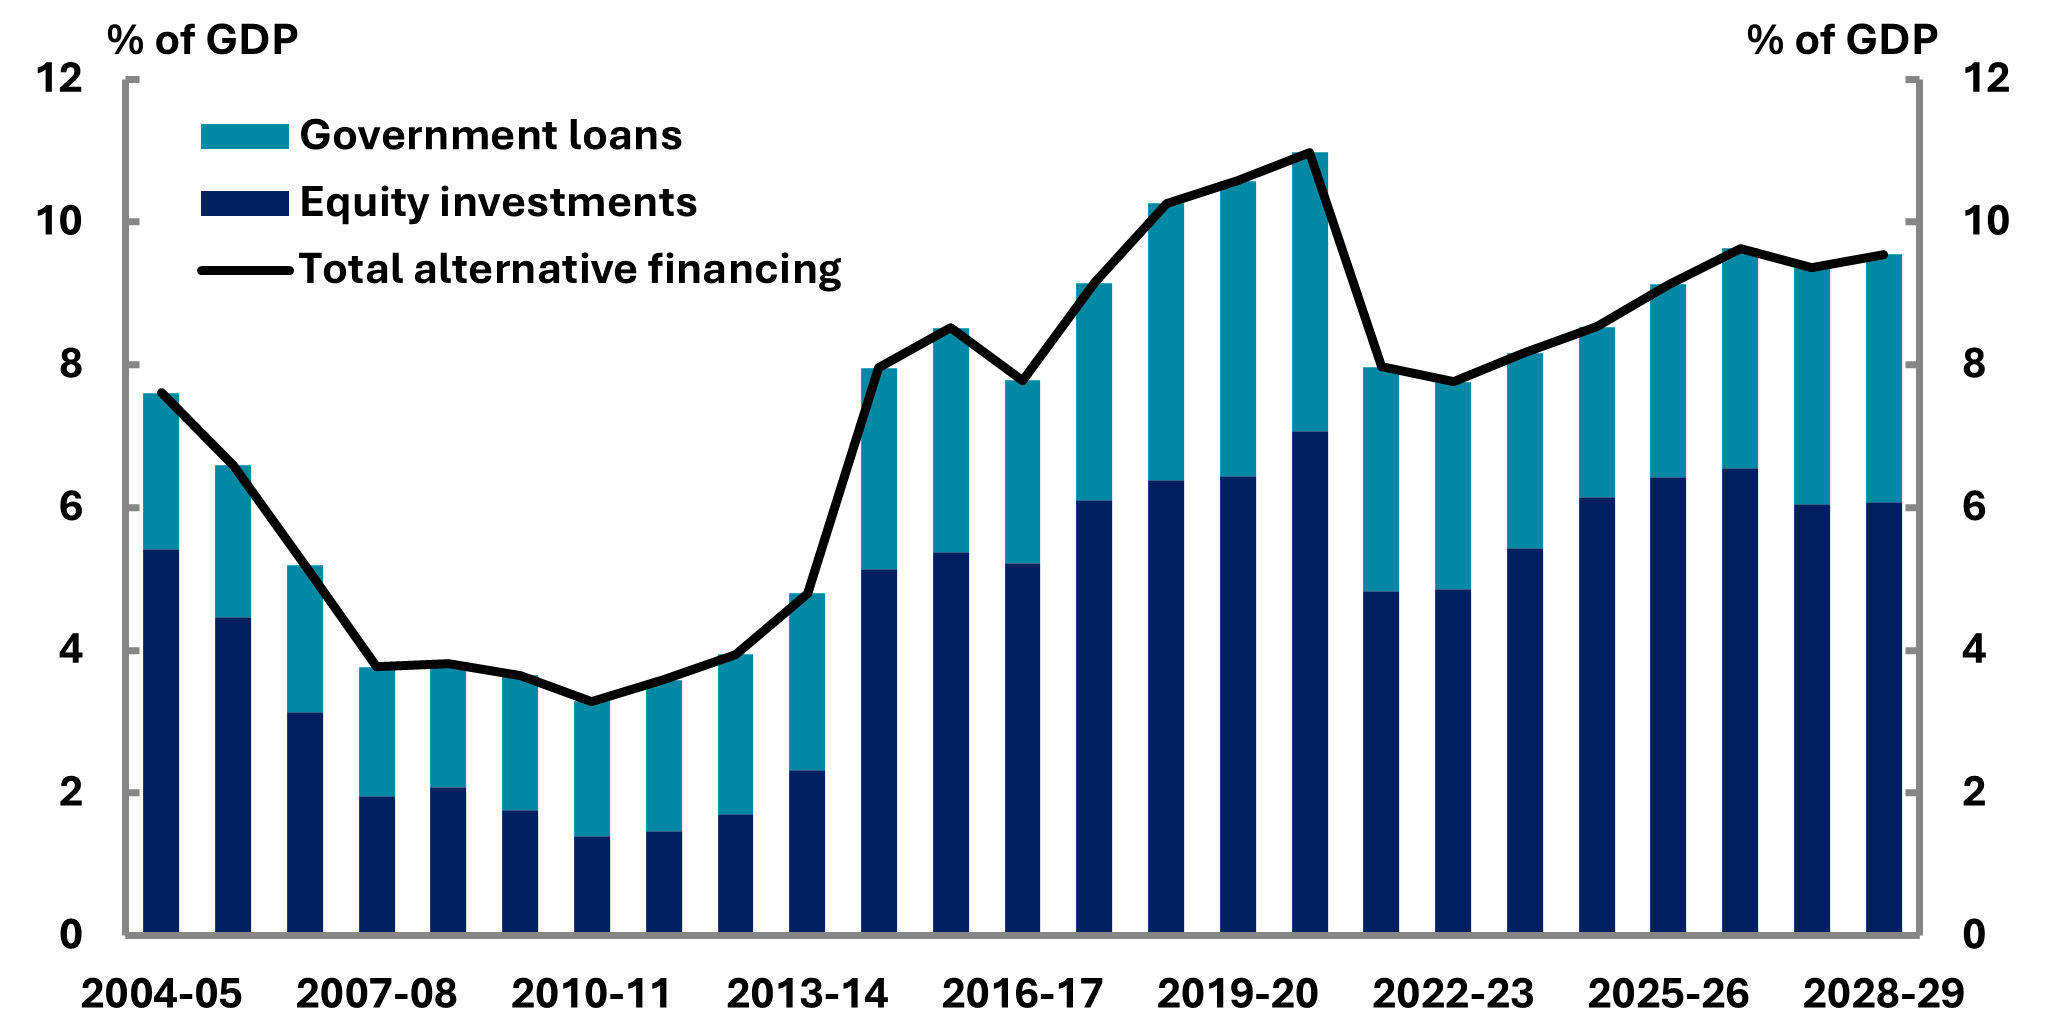
Figure 2-6 shows the stock of government investments in financial assets for policy purposes as a share of GDP from 2004-05 to 2028-29, disaggregated into equity investments and government loans.
The stock of alternative financing arrangements rose significantly between 2018-19 and 2020‑21, peaking at over 11% of GDP in 2020-21. Although the stock dipped briefly during the pandemic, it remained elevated. Current projections indicate that investments in financial assets for policy purposes will remain at around 9.5% of GDP through to 2028-29, driven by both ongoing equity investment and government loans.
Figure 2‑6: Selected investments in financial assets, 2004-05 to 2028-29
In recent years, several government policies have used these financing arrangements, rather than direct payments. In addition to the NBN, these have included:
- the National Reconstruction Fund (NRF), which provided loans, equity investment or guarantees for a range of industry projects,
- the Home Equity Access Scheme, enabling older Australians to access equity in their real estate holding through a government loan (see housing below), and
- the Housing Australia Future Fund (HAFF) provided funding for social and affordable housing through investment returns (see housing below), noting that disbursements from the HAFF will impact the UCB.
Figure 2-7 displays Australia’s net cash flows from investments in financial assets for policy purposes as a percentage of GDP from 2013-14 to projections through 2028-29.
The PBO’s report Alternative financing of government policies provides more information.
Figure 2-7: Net cash flows from investments in financial assets for policy purposes, 2013-14 to 2028-29
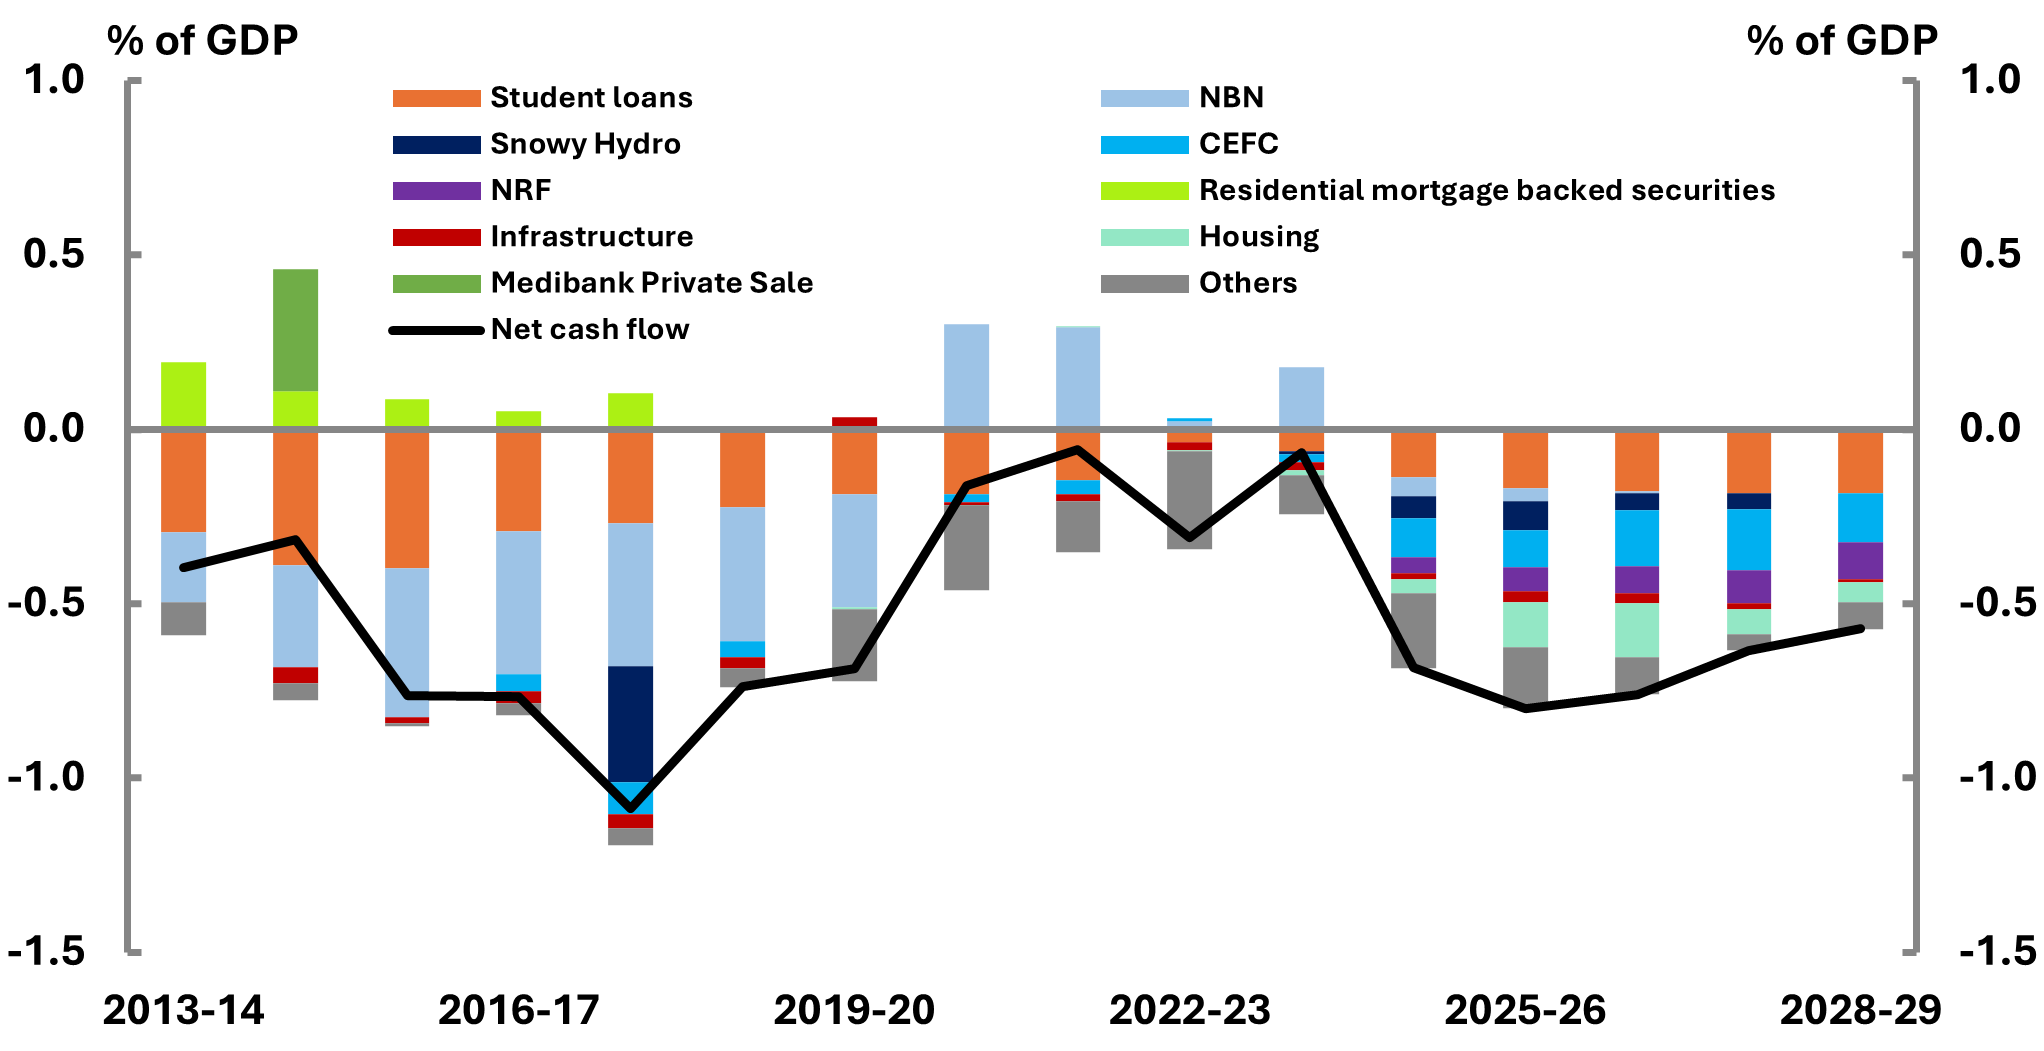
Source: Final Budget Outcomes 2008-09 to 2023-24, NBN Co annual reports 2008-09 to 2023-24, Australian Office of Financial Management annual reports, 2008-09 to 2017-18, Clean Energy Finance Corporation annual reports, 2016‑17 to 2023-24, Department of Infrastructure, Transport, Regional Development, Communications, Sport and the Arts annual reports 2016-17 to 2023-24, Department of Industry, Science and Resources annual report for 2023‑24 and PBO analysis.
3 Fiscal sustainability
- This chapter explores how government debt could evolve under a range of assumptions and whether the fiscal position is likely to be sustainable over the long term to 2068-69. It also tests how different assumptions for productivity and migration affect fiscal sustainability.
- Our scenarios show the projected long-term debt-to-GDP ratio is slightly higher compared to our analysis a year ago, due in part to revised scenario parameters.
- The fiscal position is sustainable in most scenarios considered. This means that future governments should be able to keep the debt-to-GDP ratio relatively stable through budgets of a similar scale to what we have seen previously, including both stable and volatile economic cycles.
- However, structural risks to the budget remain, including continued reliance on personal income tax, diminishing excise revenue, an ageing population, demands on defence spending levels and the NDIS. These risks may increase the extent to which government interventions are needed to keep the fiscal position sustainable.
In this analysis, fiscal sustainability refers to the government’s ability to maintain its long-term fiscal policy settings indefinitely without the need for major remedial policy interventions. This means governments need to continue to act but that historical approaches to borrowing and repaying debt can generally be maintained, while keeping taxation and spending within reasonable and expected bounds. In contrast, the government’s Intergenerational Report presents projections on the basis of no future policy changes, resulting in projections that are usually more pessimistic than those presented by the PBO.
We consider the fiscal position to be sustainable if the debt‑to‑GDP ratio is expected to be stable or trend downwards over the long term. Such circumstances provide governments the fiscal space to pursue their long-term policy objectives and to support sustainable economic growth. It allows flexibility for governments to respond to changes in economic conditions, including downturns, either through automatic or discretionary mechanisms.
The long-run trajectory for the debt-to-GDP ratio is driven by 3 parameters: the budget headline PCB (HCB before interest payments); the interest rates that apply to government debt; and economic growth (nominal GDP).
The budget does not necessarily need to be balanced or in surplus to reduce the debt-to-GDP ratio. If the rate of economic growth exceeds the rate of interest on debt, debt-to-GDP can be reduced with sufficiently small budget deficits. Accordingly, under certain circumstances budget deficits can be consistent with a fiscally sustainable position.
A sustainable position also does not mean the debt-to-GDP ratio will not increase at times, especially in response to large unforeseen economic shocks, such as the COVID-19 pandemic. In this sense, it is not necessarily the level of debt that determines if the fiscal position is sustainable, but whether, on average, the debt-to-GDP ratio is expected to remain stable or trend downwards over the medium and long term.
By comparison, the fiscal position may not be sustainable if the debt-to-GDP ratio is expected to trend upwards over the long term. In such circumstances, more significant interventions would be needed to reduce deficits and keep debt broadly stable as a percentage of GDP.
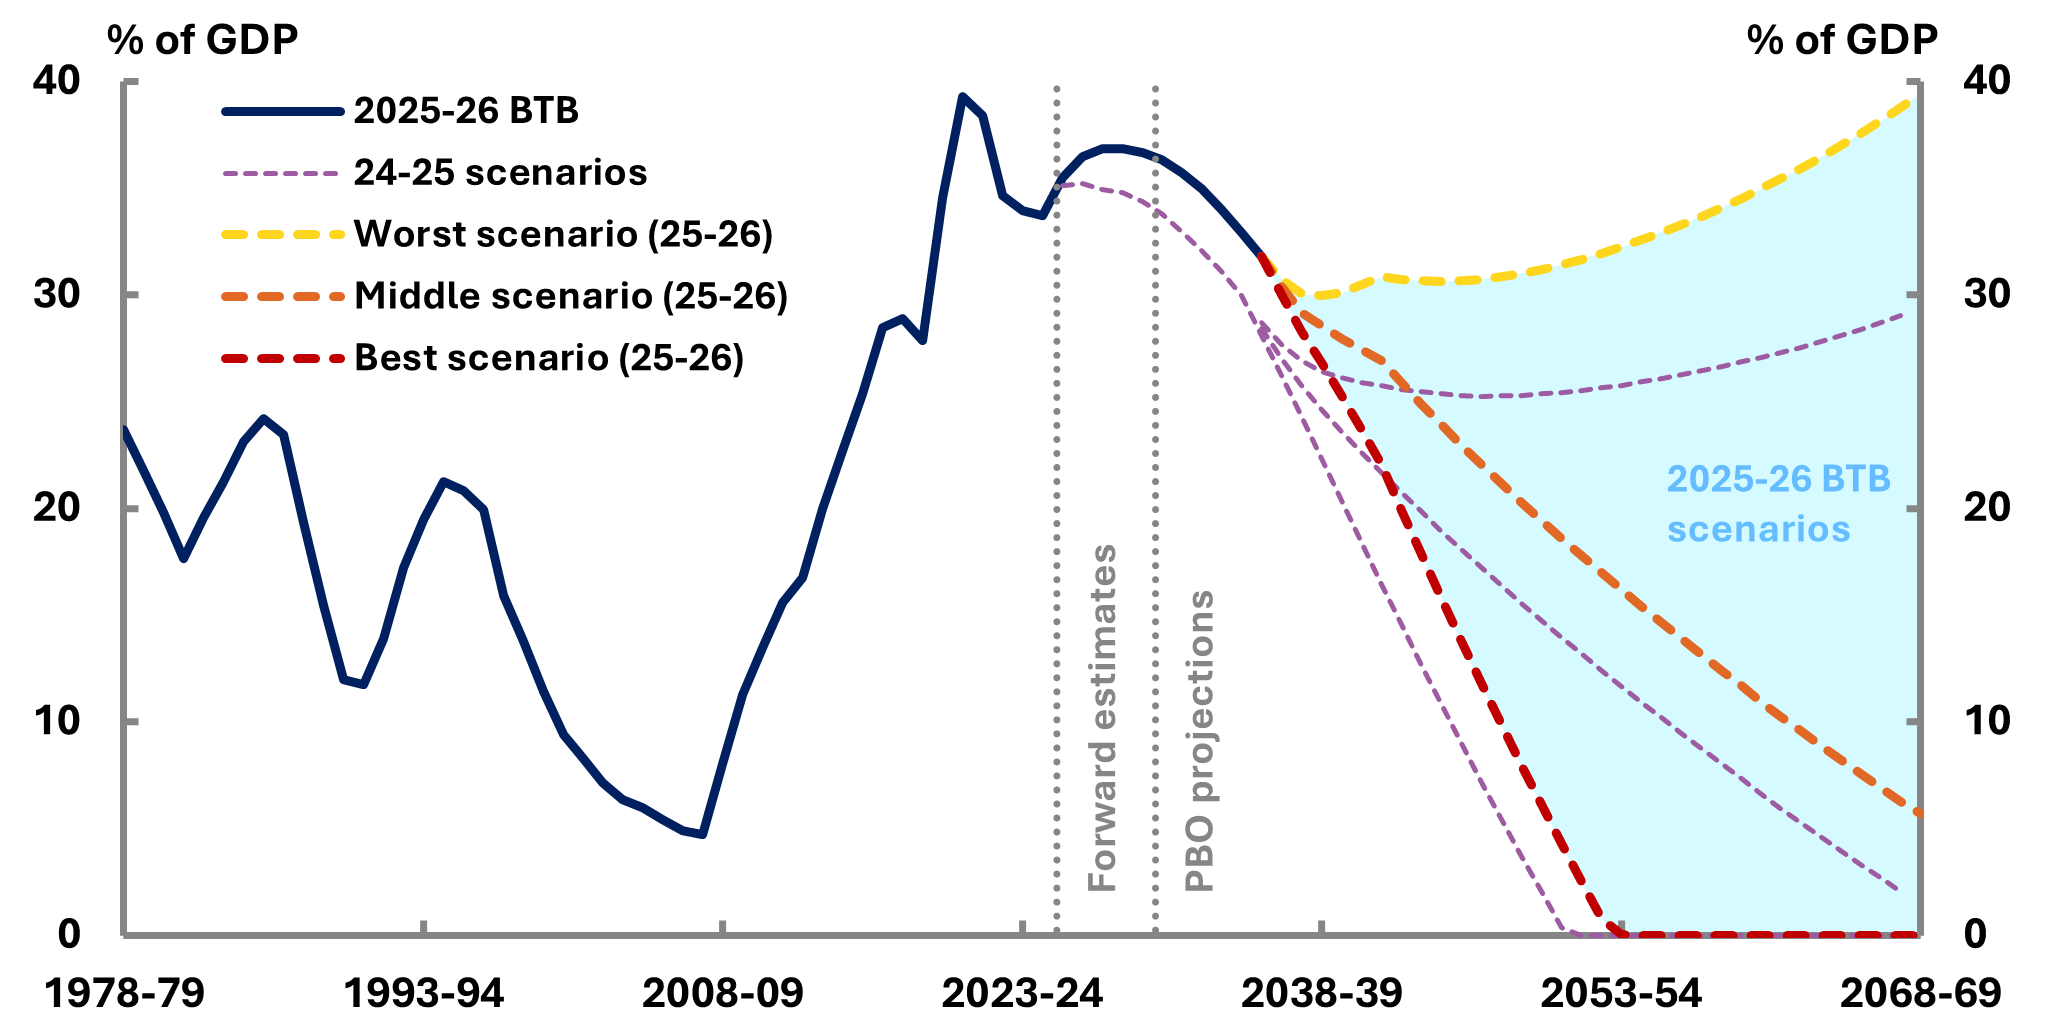
In our fiscal sustainability analysis, we examine 27 possible scenarios for the debt-to-GDP ratio over a 40-year period. Each scenario reflects variations in 3 parameters (the primary budget balance, interest rates and economic growth) and is consistent with low, middle, and high ranges throughout history. We refer to these variations as ‘cases’. For example, one scenario might combine our middle case for the budget balance, our best case for interest rates, and our worst case for GDP growth.
Each of our scenarios represent a possible future trajectory for the debt-to-GDP ratio, but we do not make any judgement as to which scenario is most likely. For instance, our middle scenario should not be considered as a baseline or most-likely trajectory. Instead, we are illustrating what the path could be under a range of economic and policy conditions.
Importantly, the overall best- and worst-case scenarios represent combinations of interest rates and economic growth that would be unlikely to persist for an extended period of time. For example, should economic growth slow to the rate assumed in the worst scenario, the Reserve Bank of Australia (RBA) may respond by lowering interest rates, offsetting the impacts on the budget balance. The extreme scenarios are intended to illustrate that the budget is generally sustainable even assuming highly unlikely combinations of long-term economic growth, interest rates and budget balances.
By building our scenarios around historical averages, we have implicitly captured the impact of future economic shocks and policy changes, to the extent that these are of a similar magnitude and regularity to those of the past. However, if future economic or climate change shocks were comparatively larger or more frequent than historical shocks, or if long-term structural shifts meant that GDP growth rates were comparatively much lower, this would make maintaining a fiscally sustainable position more difficult.
Our scenarios also use historical average budget balances to guide our scenarios, on the basis that future governments can respond to their challenges to a similar extent as those of the past. It is important to note, however, that some past government actions may not be available in the future. For example, certain assets cannot be resold (e.g. the Commonwealth Bank or Telstra), and some taxes cannot be reintroduced (e.g. the GST).
For further information on the framework we use to assess fiscal sustainability, see our report on Fiscal sustainability.
Table 3-1 shows our middle, best, and worst cases. The results of all 27 scenarios are shown in Figure 3-1.
Table 3 1: Cases for middle, best and worst scenarios
|
Parameters |
|||
|---|---|---|---|
| Cases |
Interest rates |
Nominal GDP |
Primary Budget Balance |
| Middle |
Interest rates reach 4.4% by 2068-69 |
Nominal GDP growth reaches 4.4% by 2068-69 |
The budget maintains a sustained modest surplus from 2035-36 through to 2068-69 |
| Best |
Interest rates reach 3.5% by 2068-69 |
Nominal GDP growth reaches 5.2% by 2068-69 |
The budget maintains a sustained stronger surplus from 2035-36 through to 2068-69 |
| Worst |
Interest rates reach 5.2% by 2068-69 |
Nominal GDP growth reaches 3.5% by 2068-69 |
The budget balance remains broadly balanced from 2035-36 through to 2068-69 |
In 23 of our 27 long-term scenarios, the debt-to-GDP ratio is expected to trend downwards over the long term (compared to 24 of the 27 scenarios in the previous report). This suggests that the fiscal position is likely to continue to be sustainable in all but the most extreme circumstances.
Figure 3-1: Gross debt, 1978-79 to 2068-69
Source: 2024-25 Budget, 2025-26 Budget and PBO analysis.
Gross debt, as a share of GDP, is expected to decline in all but the worst-case scenarios by the end of the long term. In comparison to our 2024-25 analysis, the long-term debt-to-GDP ratio is higher by the end of the long term in each scenario. This difference between iterations is attributed to higher revisions in expected interest rates and nominal GDP growth.
For example, in our middle scenario the debt-to-GDP ratio is projected to peak at 36.9% of GDP in 2027‑28, before trending down to 5.7% by 2068‑69. By comparison, the middle scenario in our 2024‑25 analysis showed debt-to-GDP peaking at 35.2% of GDP in 2026‑27 before declining to 2.1% of GDP by 2067‑68.
4 Fiscal sustainability scenarios: productivity and migration
- This chapter explores the impacts of various productivity growth and net overseas migration levels on the budget.
- Both higher productivity growth and higher migration improve long-term fiscal sustainability.
- In addition to direct revenue and expense impacts on the budget, broader economic trends impact the fiscal sustainability of the budget.
- The PBO’s Build your own budget tool allows users to directly explore the impacts of these and other economic and policy setting. The tool does not include a macroeconomic framework and hence cannot analyse the source or nature of economic scenarios. However, it does contain a sophisticated translation of economic scenarios through to fiscal impacts, making the tool useful for asking how the budget might be affected.
‘Productivity’ refers to the quantity of economic output compared to the inputs. The most common measure of productivity is real GDP per hour worked, known as ‘labour productivity’. Over a long period of time, productivity increases due to improvements in technology, which ranges from new machinery to easier access to information or developments in organisational structures. This growth translates into higher national wealth, increased employment and consequently a greater ability to conduct fiscal policy.
Strong productivity growth boosts government revenues through higher tax receipts without raising statutory tax rates and in turn makes it easier to maintain a sustainable fiscal position. In contrast, low productivity growth can stall economic growth, making existing debt more difficult to manage. Sustained improvements in productivity are essential to maintaining a fiscally sustainable position and reduce long-term debt pressures.
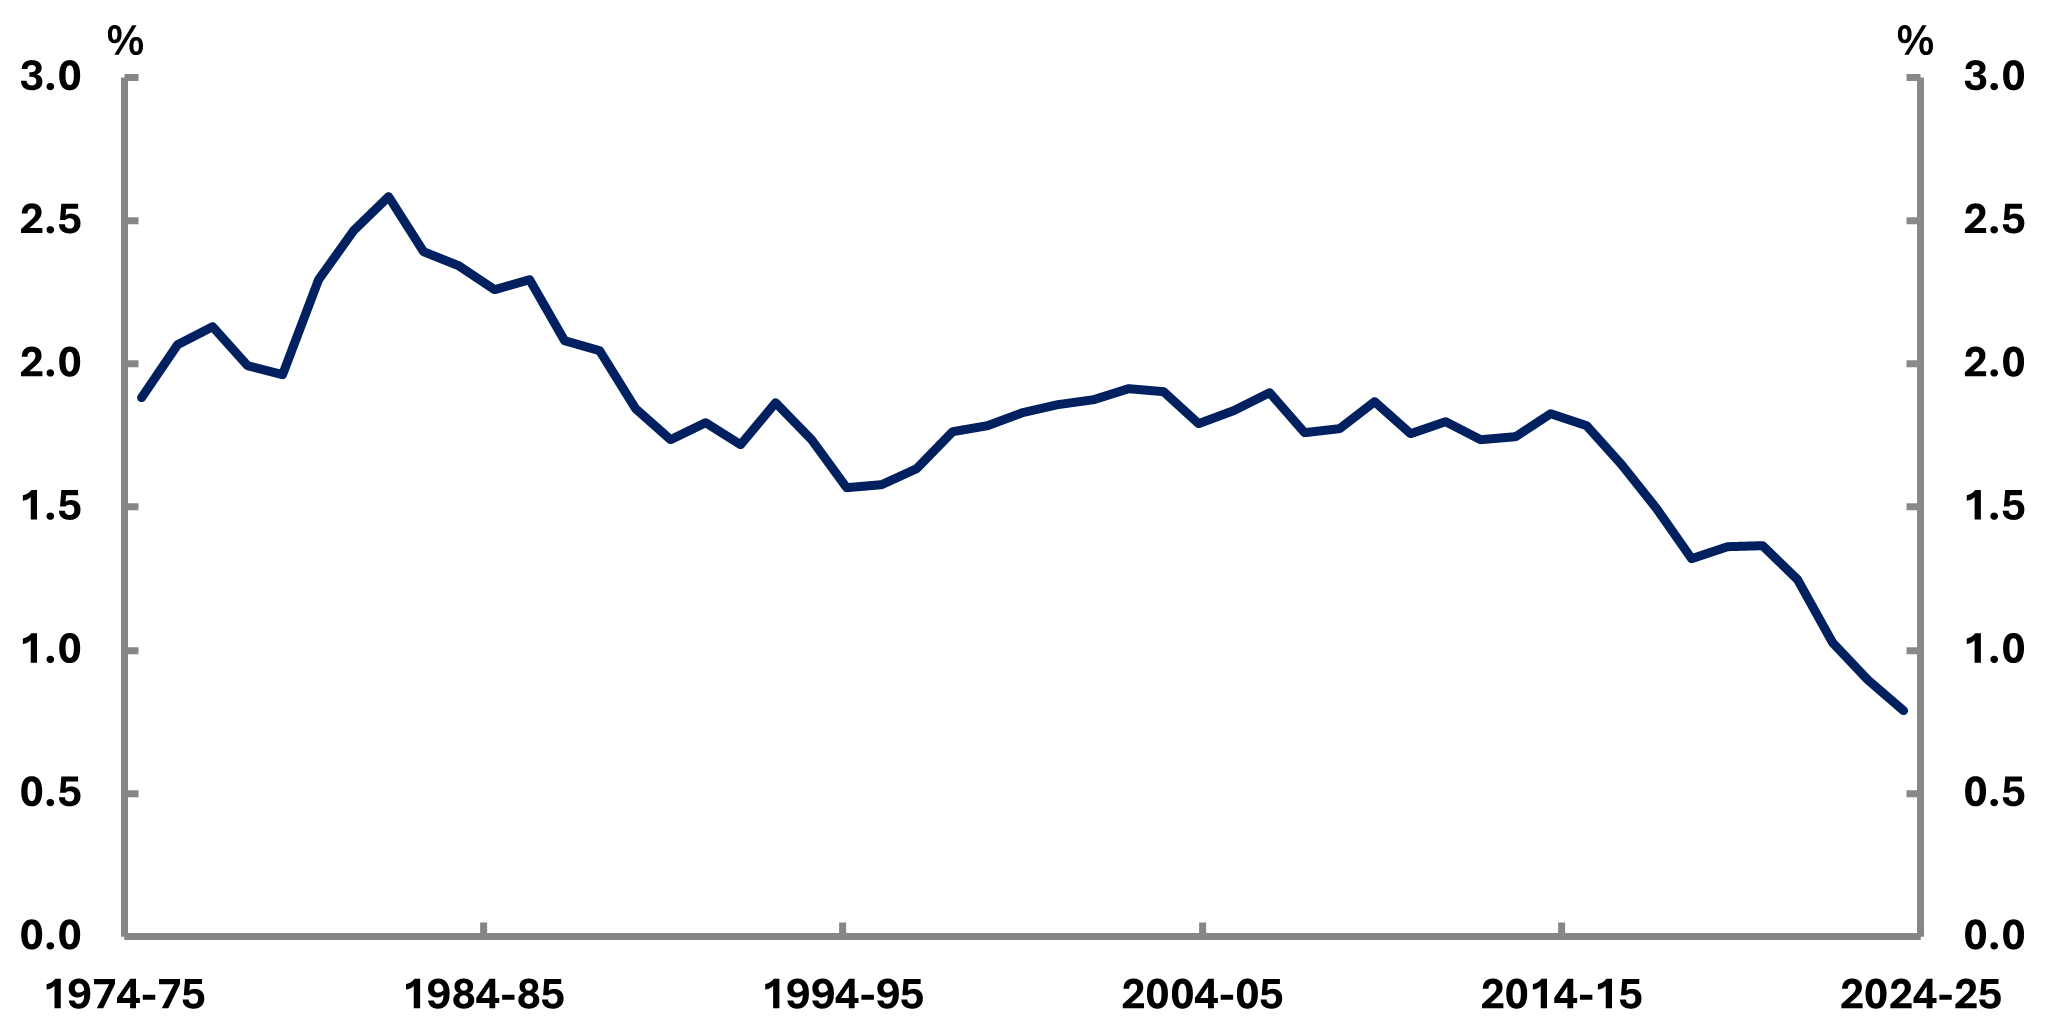
In this report, the PBO does not seek to answer why productivity growth has slowed but instead examines the fiscal implications of slower growth continuing. Over the past 2 decades, productivity growth recorded an average yearly growth rate of 0.8%. The time-series data (Figure 4-1) presents the compound yearly growth rate of labour productivity, measured as Gross Value Added (GVA) per hour worked. It shows that productivity growth was relatively stable in the mid-2000s, but began to weaken after 2010, with sustained decline in recent years. By 2024-25, the growth rate had fallen to nearly half of the average recorded over the preceding 20 years.
Figure 4-1: Compound yearly growth rate of labour productivity over previous 20 years, Australia,1974-75 to 2024-25
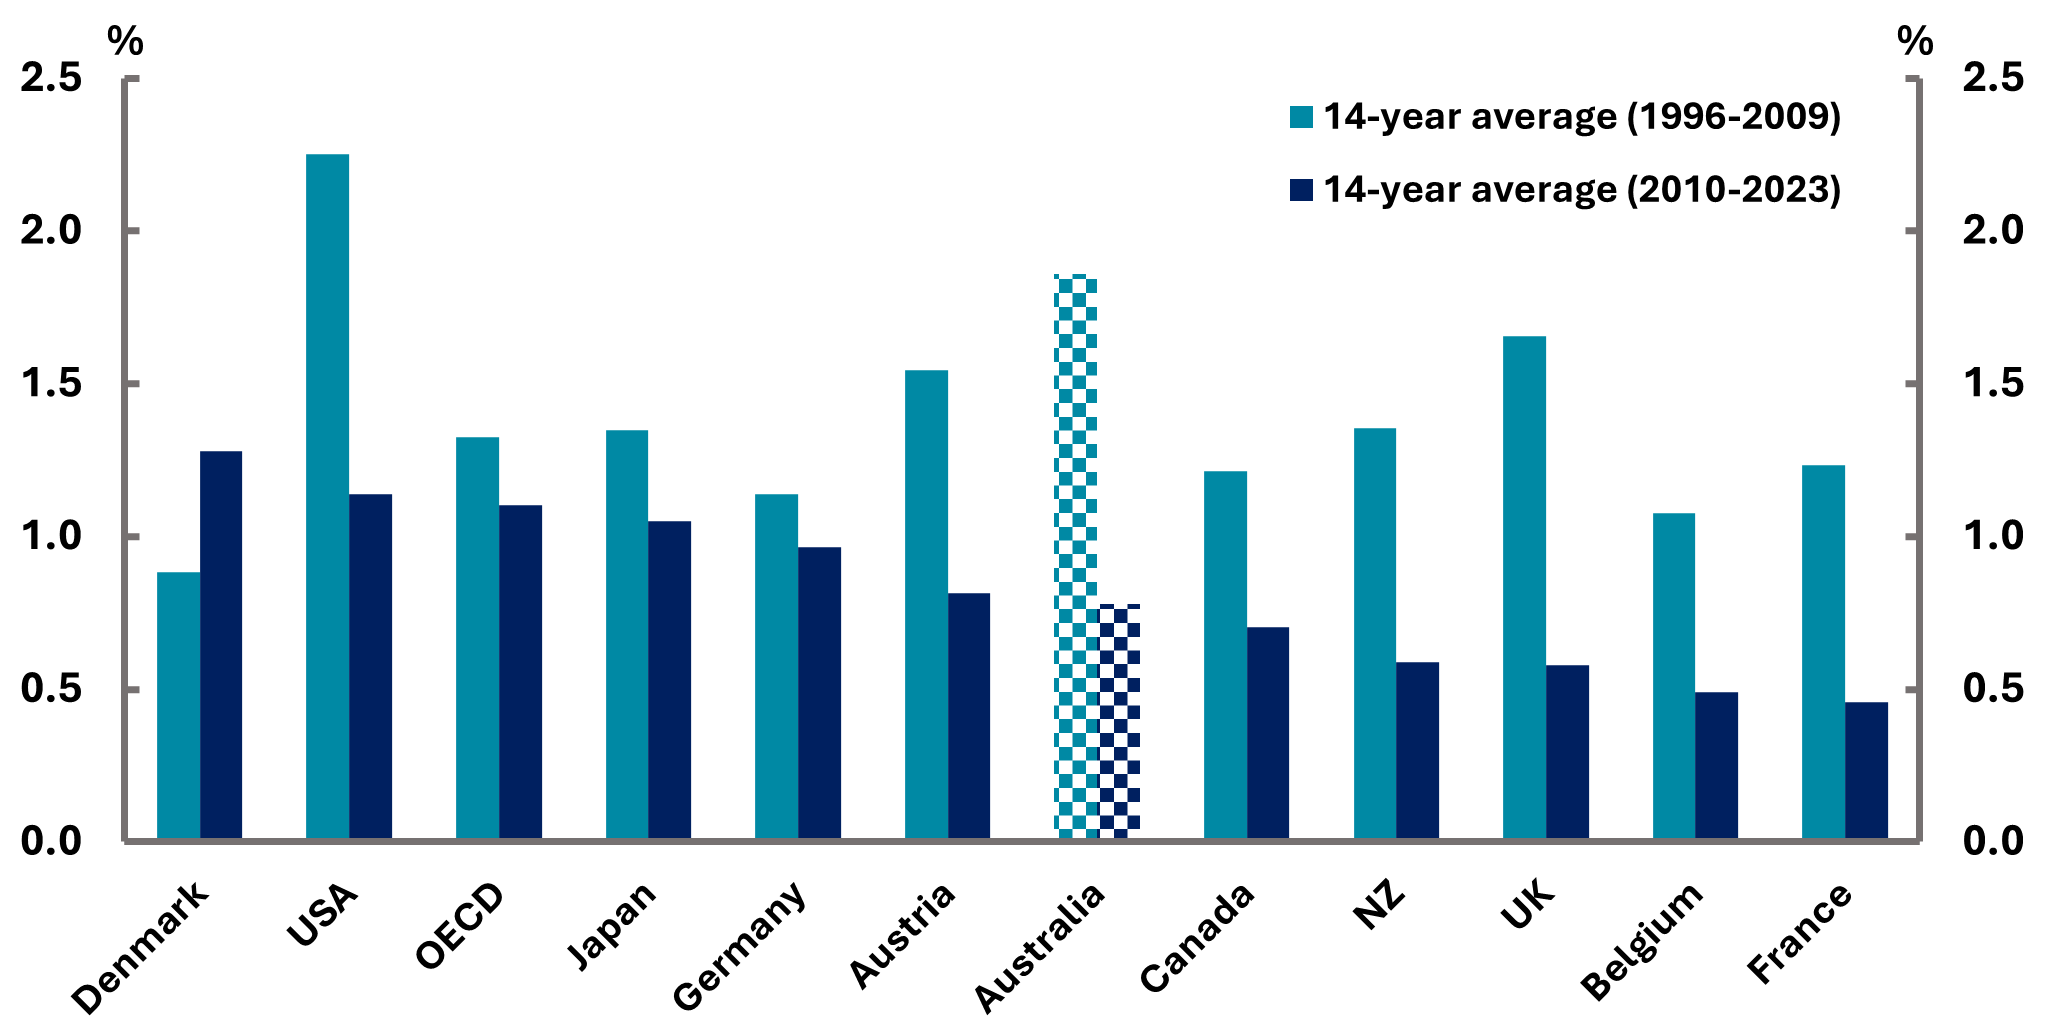
This slowdown is not just an Australian phenomenon. It reflects a broader global trend across advanced economies. Almost every developed nation has experienced declining productivity growth over the last 14 years. Between 2010 and 2023, Canada’s labour productivity growth averaged around 0.7%, while Australia performed slightly better at 0.8% (Figure 4-2). However, when compared with the OECD average of around 1.1%, Australia’s productivity growth still fell short.
Figure 4-2: 14-year average productivity growth – Australia and international comparison
For many years the budget assumed medium-term yearly productivity growth of 1.5%. Since the 2022-23 October Budget, the assumption has been 1.2%, reflecting the recent outcomes.
At its most recent Statement on monetary policy in August,[7] the RBA revised its assumption for medium-term yearly productivity growth from 1.0% to 0.7%.
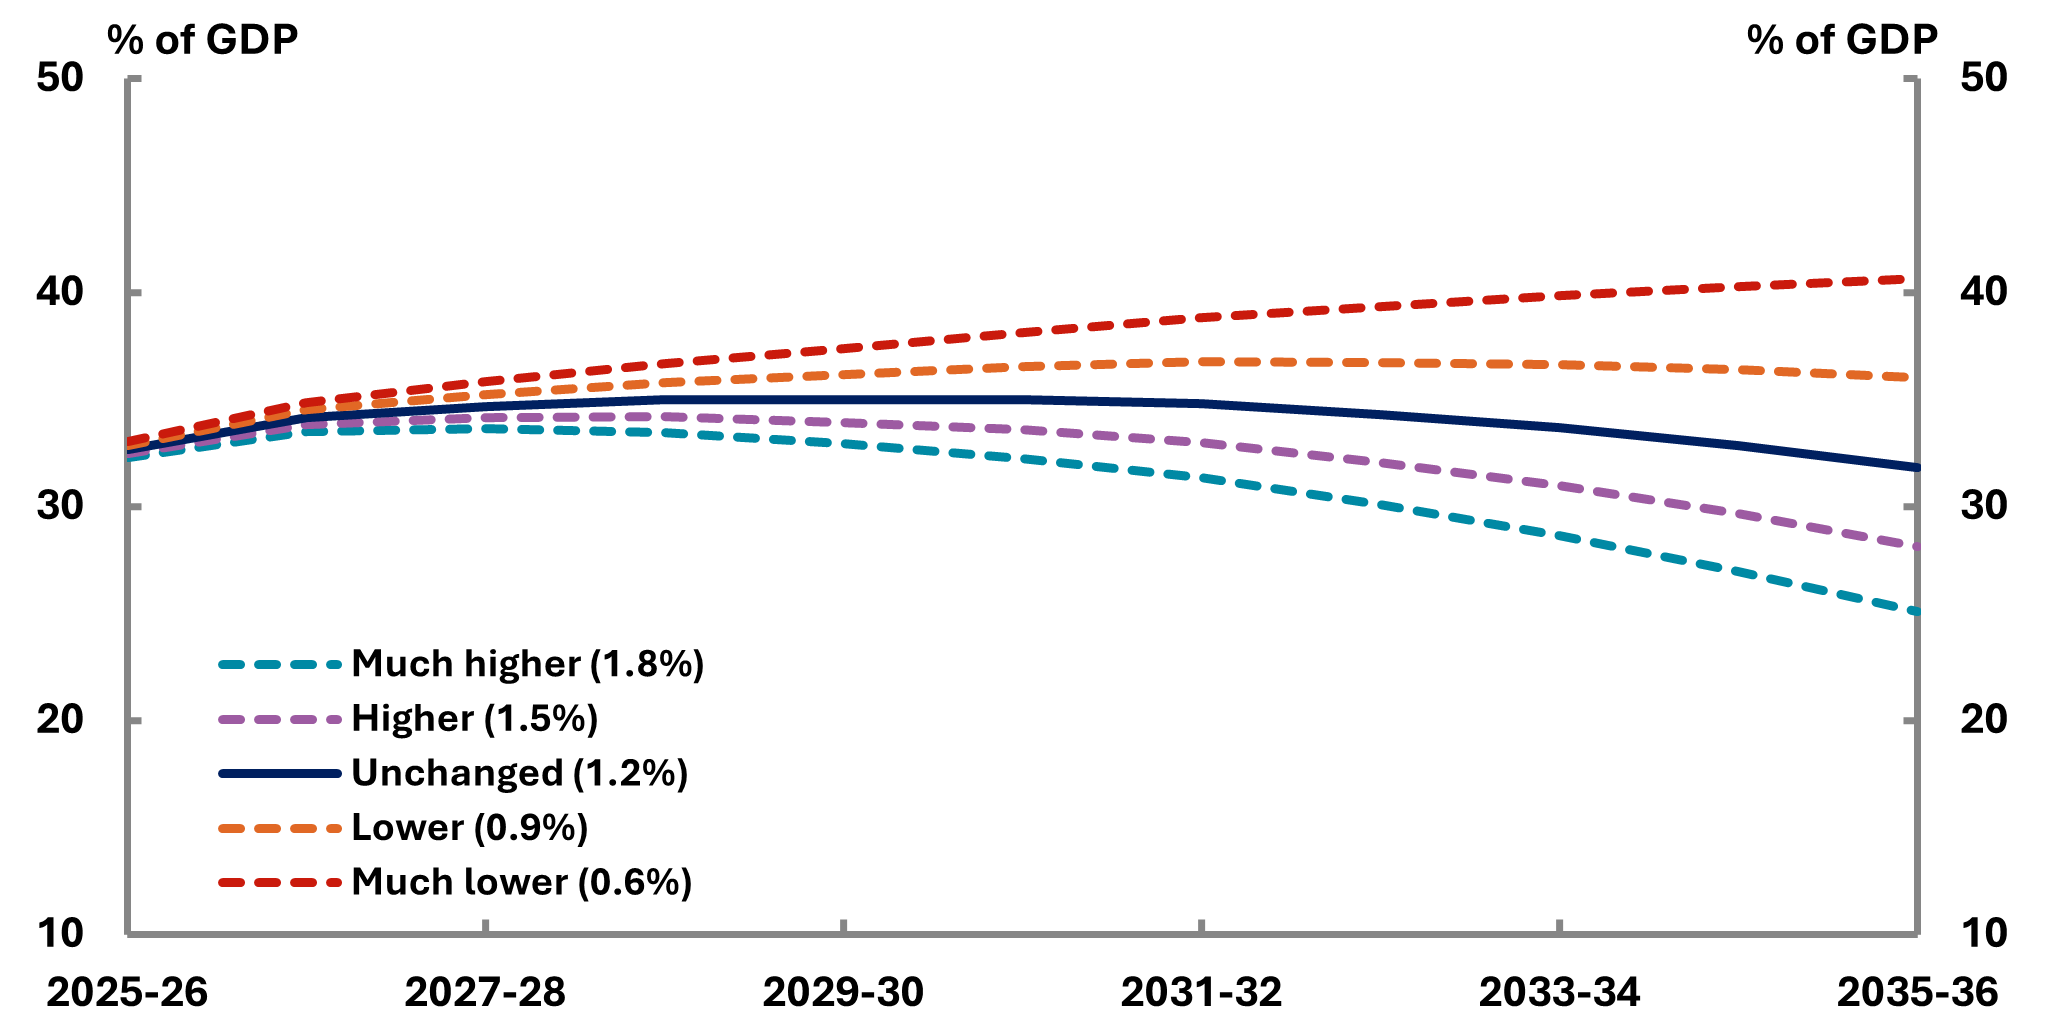
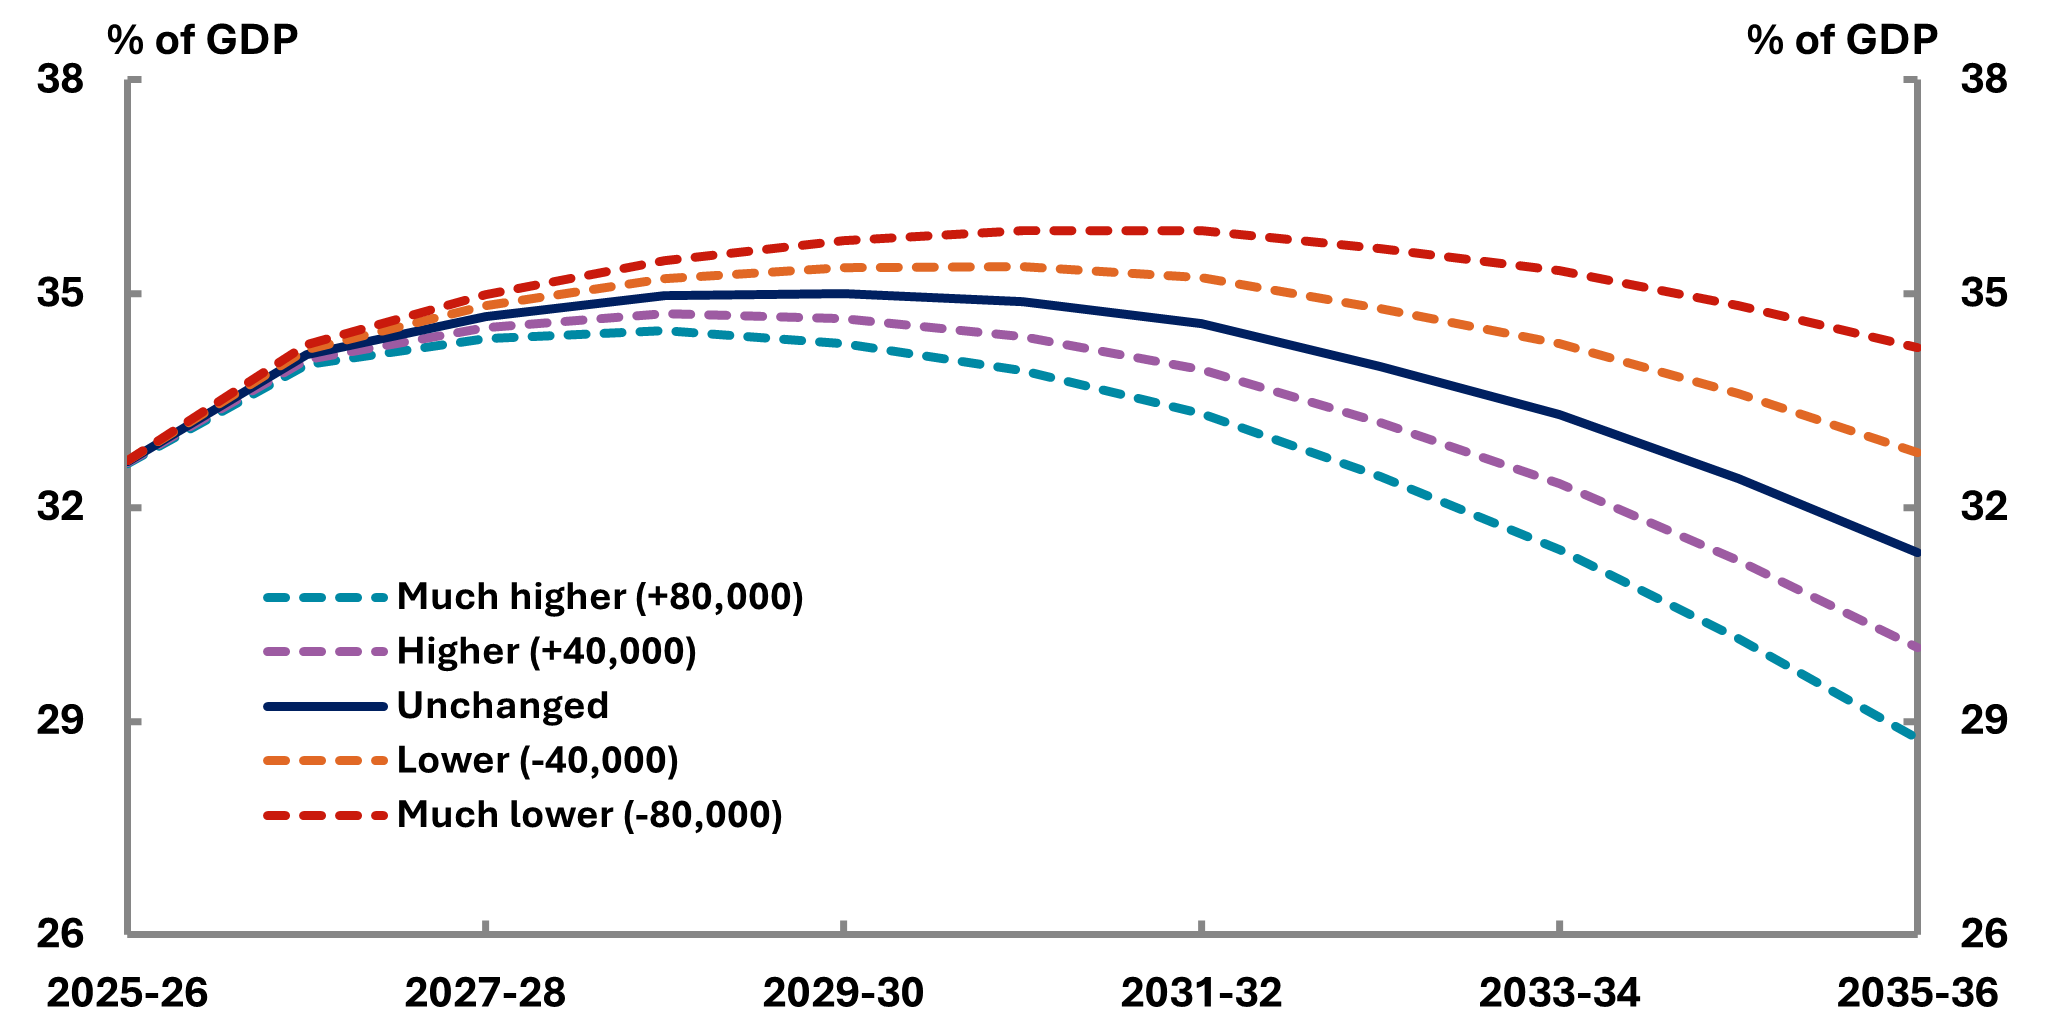
Figure 4-3 shows 5 scenarios of different productivity growth, ranging from much lower to much higher growth, correlating with the respective impacts on Australia’s debt to GDP trajectory. With lower productivity growth scenario (0.9%), the debt-to-GDP ratio would be 3.6 percentage points higher by 2035‑36, or an additional $119 billion of debt.
Figure 4-3: Debt-to-GDP Scenarios – Productivity growth, 2025-26 to 2035-36
Source: 2025-26 Budget and PBO analysis.
Changes to productivity growth do not occur in isolation. The simple scenarios presented here do not assume any associated changes to employment, inflation and interest rates which might exacerbate any impacts.
All else being equal, weaker economic growth may be more likely to result in more stimulatory monetary policy settings through lower interest rates, but this is not certain. Lower productivity growth coupled with higher inflation is also possible.
Note, however, that in either case, the fiscal impact is likely to be cushioned. In the case of lower interest rates, the cost of servicing debt would decrease, helping the budget. In the case of higher inflation, the budget would benefit from additional taxes, particularly through bracket creep.
In the latter case, of lower productivity growth across the globe, the commonwealth’s fiscal position would be relatively better off but still face very significant challenges.
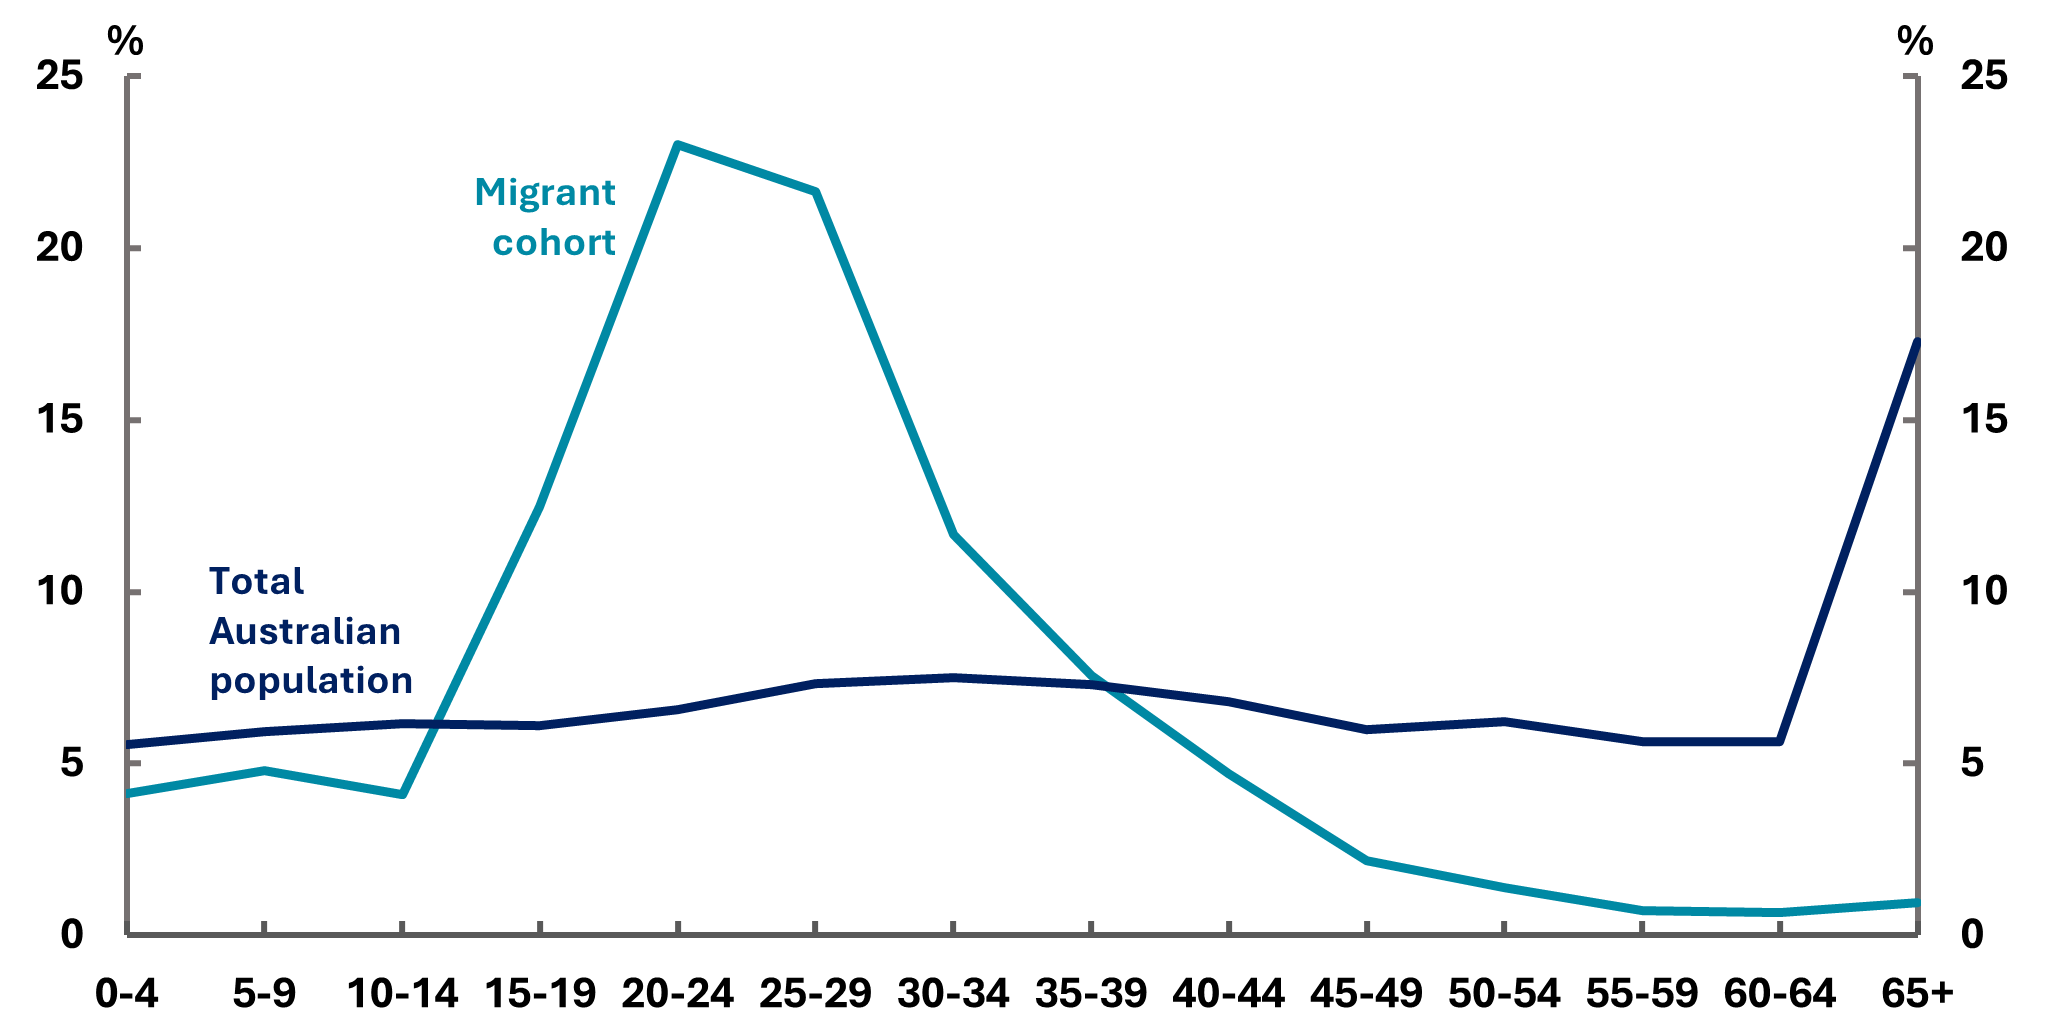
Net Overseas Migration (NOM) plays a significant role in shaping fiscal sustainability, with impacts to both expenses and revenue. Migrants may contribute to public finances through taxes, fees, and economic activity that drives revenue growth. At the same time, they incur short and long-term costs in areas like health care, social services, education, and infrastructure investment. Migrants typically have a more positive fiscal impact than the total population, as they are more concentrated around the working age cohort (Figure 4-4). In addition to this, migrants have not received Australian public services, particularly education and health care services prior to arriving in Australia, leading to a larger fiscal effect than the equivalent aged existing Australian resident. Migrants may also need to stay in Australia for several years before qualifying for some government payments.
Figure 4-4: Age Distribution of the Australian population and migrant cohort 2023-24
We model debt-to-GDP in 5 different NOM scenarios (see Table 4-1). The baseline scenario is sourced from national population projections by the Centre for Population. Each higher and lower scenario adjusts the baseline by increments of 40,000 individuals.
Table 4-1: Net Overseas Migration Scenarios
| Scenarios |
Thousands |
|||||||||
|---|---|---|---|---|---|---|---|---|---|---|
|
2025-26 |
2026-27 |
2027-28 |
2028-29 |
2029-30 |
2030-31 |
2031-32 |
2032-33 |
3033-34 |
3035-36 |
|
| Much Higher (+80,000) |
342.3 |
303.4 |
306.0 |
308.3 |
309.4 |
310.6 |
311.7 |
312.8 |
313.9 |
315.0 |
| Higher (+40,000) |
302.3 |
263.4 |
266.0 |
268.3 |
269.4 |
270.6 |
271.7 |
272.8 |
273.9 |
275.0 |
| Baseline |
262.3 |
223.4 |
226.0 |
228.3 |
229.4 |
230.6 |
231.7 |
232.8 |
233.9 |
235.0 |
| Lower (-40,000) |
222.3 |
183.4 |
186.0 |
188.3 |
189.4 |
190.6 |
191.7 |
192.8 |
193.9 |
195.0 |
| Much Lower (-80,000) |
182.3 |
143.4 |
146.0 |
148.3 |
149.4 |
150.6 |
151.7 |
152.8 |
153.9 |
155.0 |
Note: Centre for Population 2025, National population projections in the 2025-26 Budget, 2024-25 to 2035-36, the Australian Government, Canberra and PBO analysis.
Figure 4-5 shows the results of the above 5 scenarios. Debt-to-GDP is expected to decline in all of our scenarios by the end of the medium term when compared to 2025-26 levels. The ‘Much higher’ scenario however shows that the debt-to-GDP decreases to 28.8% by 2035-36, compared to 34.2% in the ‘Much lower’ scenario. This trend shows the fiscal improvements to the budget of net migration into Australia.
Figure 4-5: Debt-to-GDP Scenarios – Net Overseas Migration, 2025-26 to 2035-36
Source: 2025-26 Budget and PBO’s Build your own budget tool.
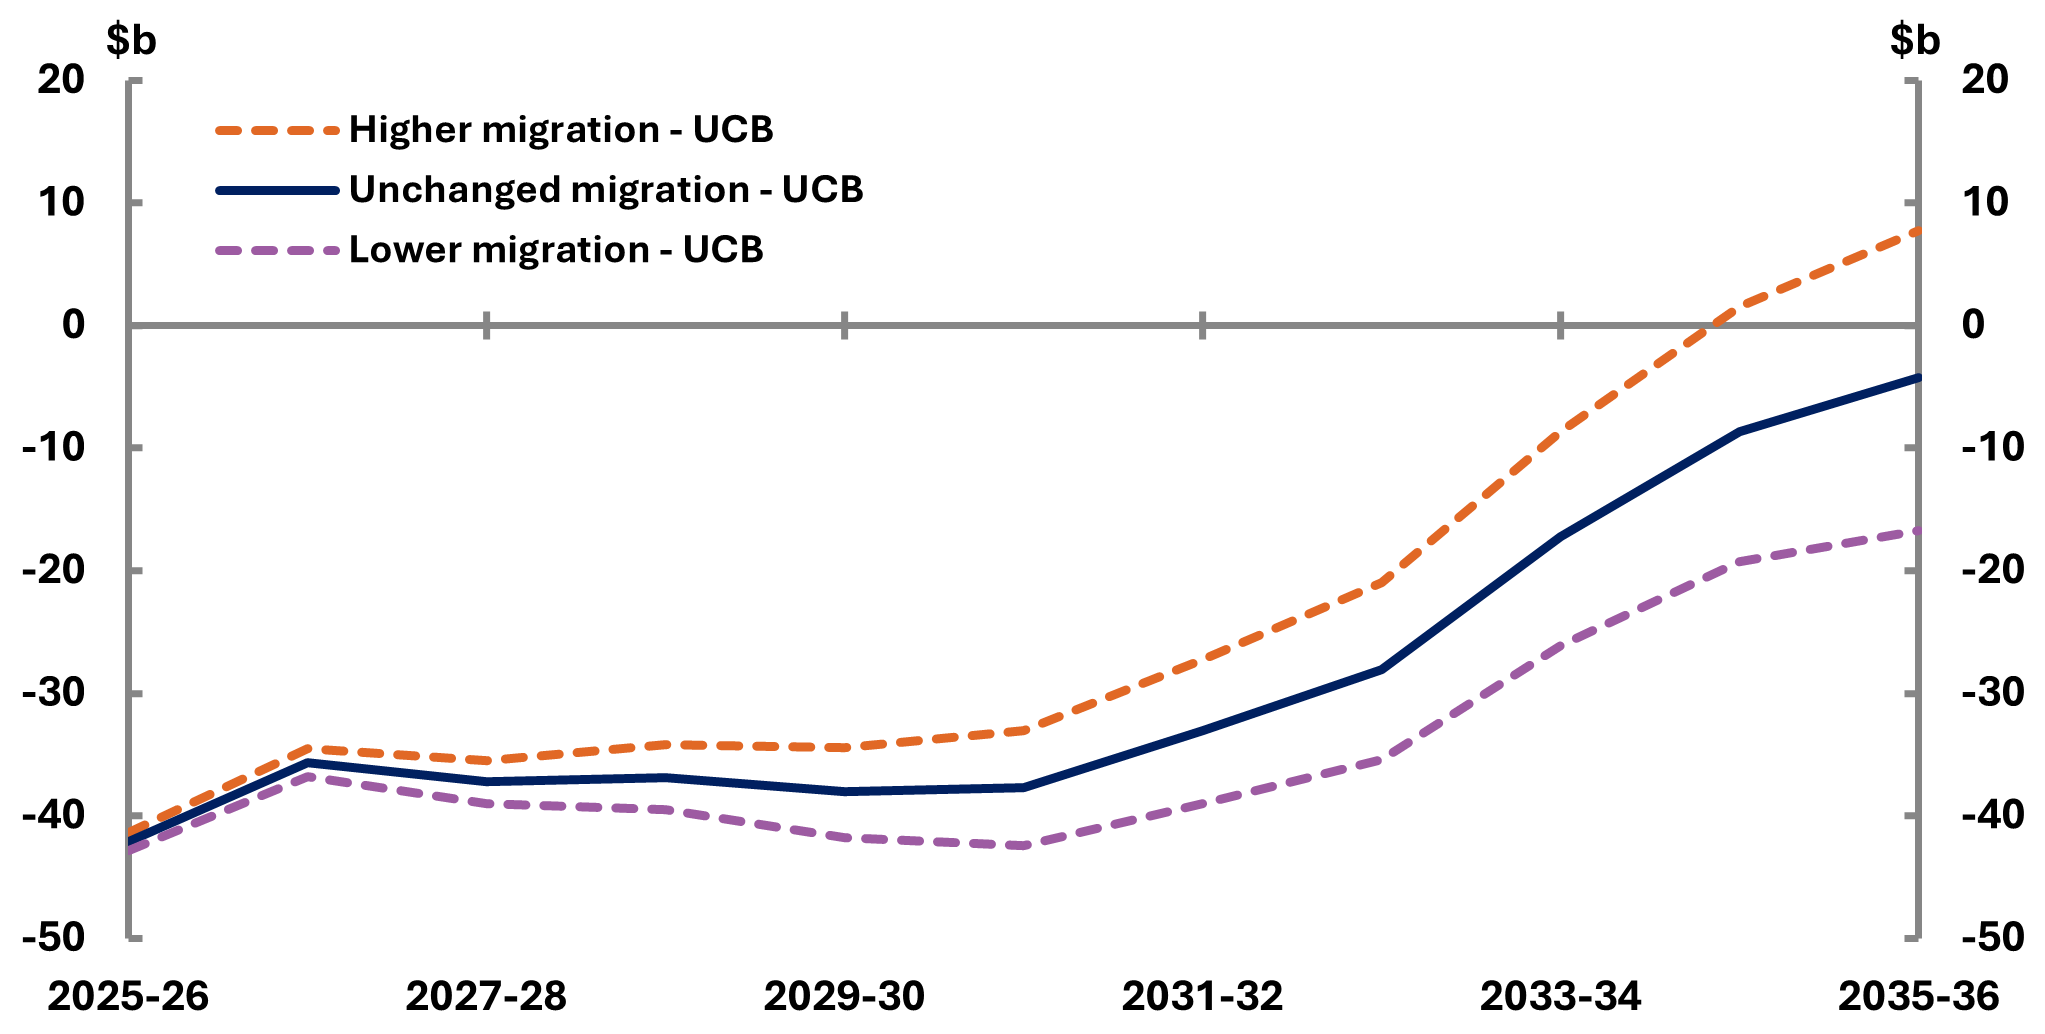
Under the scenario of ‘higher’ NOM (+40,000 permanent migrants), the UCB would improve by around $58 billion over the medium term (Figure 4-6). The primary driver of this growth is an increase in revenue, the majority attributed to income tax revenue. Personal income tax makes up the majority of income tax revenue, followed by company tax, superannuation funds and other income tax.
Conversely, expenses increase over the medium term with grants making up the largest expense by the end of the medium term. This trend is driven by grants given to states and territories, grants for general revenue assistance, and school grants.
Figure 4-6: Net Overseas Migration Scenarios – Underlying Cash Balance, 2025-26 to 2035-36
5 Revenue
- This chapter presents our projections for the budget’s various sources of revenue.
- Total revenue is projected to increase from 26.1% of GDP in 2025-26 to 27.4% of GDP in 2035-36, higher than our 2024-25 projections due to higher than projected personal income tax more than offsetting declines in projected excise revenue.
- Personal income tax continues to make up the largest proportion of the tax base, rising to 53.0% as a share of total revenue by 2035-36.
- Despite the 2025-26 Budget measure Personal Income Tax – new tax cuts for every Australian taxpayer, personal income tax is projected to increase to 14.5% of GDP in 2035-36.
- Company tax revenue as a percent of GDP is projected to fall from 5.0% in 2025-26 to 4.7% in 2027-28, then stabilise at 4.7% across the medium term to 2035-36. This decrease reflects an assumption that commodity prices will return to their long-run rate and company tax collections will stabilise.
- Indirect tax revenue is projected to decline slightly over the medium term, from around 5.6% as a share of GDP in 2028-29 to 5.2% in 2035-36.
- Goods and services tax (GST) revenue is projected to decline slightly from 3.5% of GDP in 2025 26 to 3.4% by 2035-36, as are most other revenue sources.
Total revenue is projected to be slightly higher as a share of GDP compared to last year’s projections (Figure 5-1). Revisions over the medium term reflect a $26.7 billion increase to revenue over the forward estimates period in the 2025-26 Budget, with upwards revisions to personal income tax and superannuation tax outweighing a large downwards revision to excise and customs duty and a minor downwards revision to company tax.
Notably, the 2025-26 Budget is only the second in the past decade which has not benefited from upward revisions to forecast corporate profits, mainly through higher-than-expected commodity prices. Since the 2020-21 pandemic budget, forecast corporate profits have been revised upwards over the forward estimates by around 10%, resulting in significantly more company tax than previously forecast.
While increased spending in previous years has often been offset by temporary revenue windfalls (largely driven by stronger-than-expected commodity prices) these gains have not repeated this time.
Figure 5-1: Total revenue, 2005-06 to 2035-36
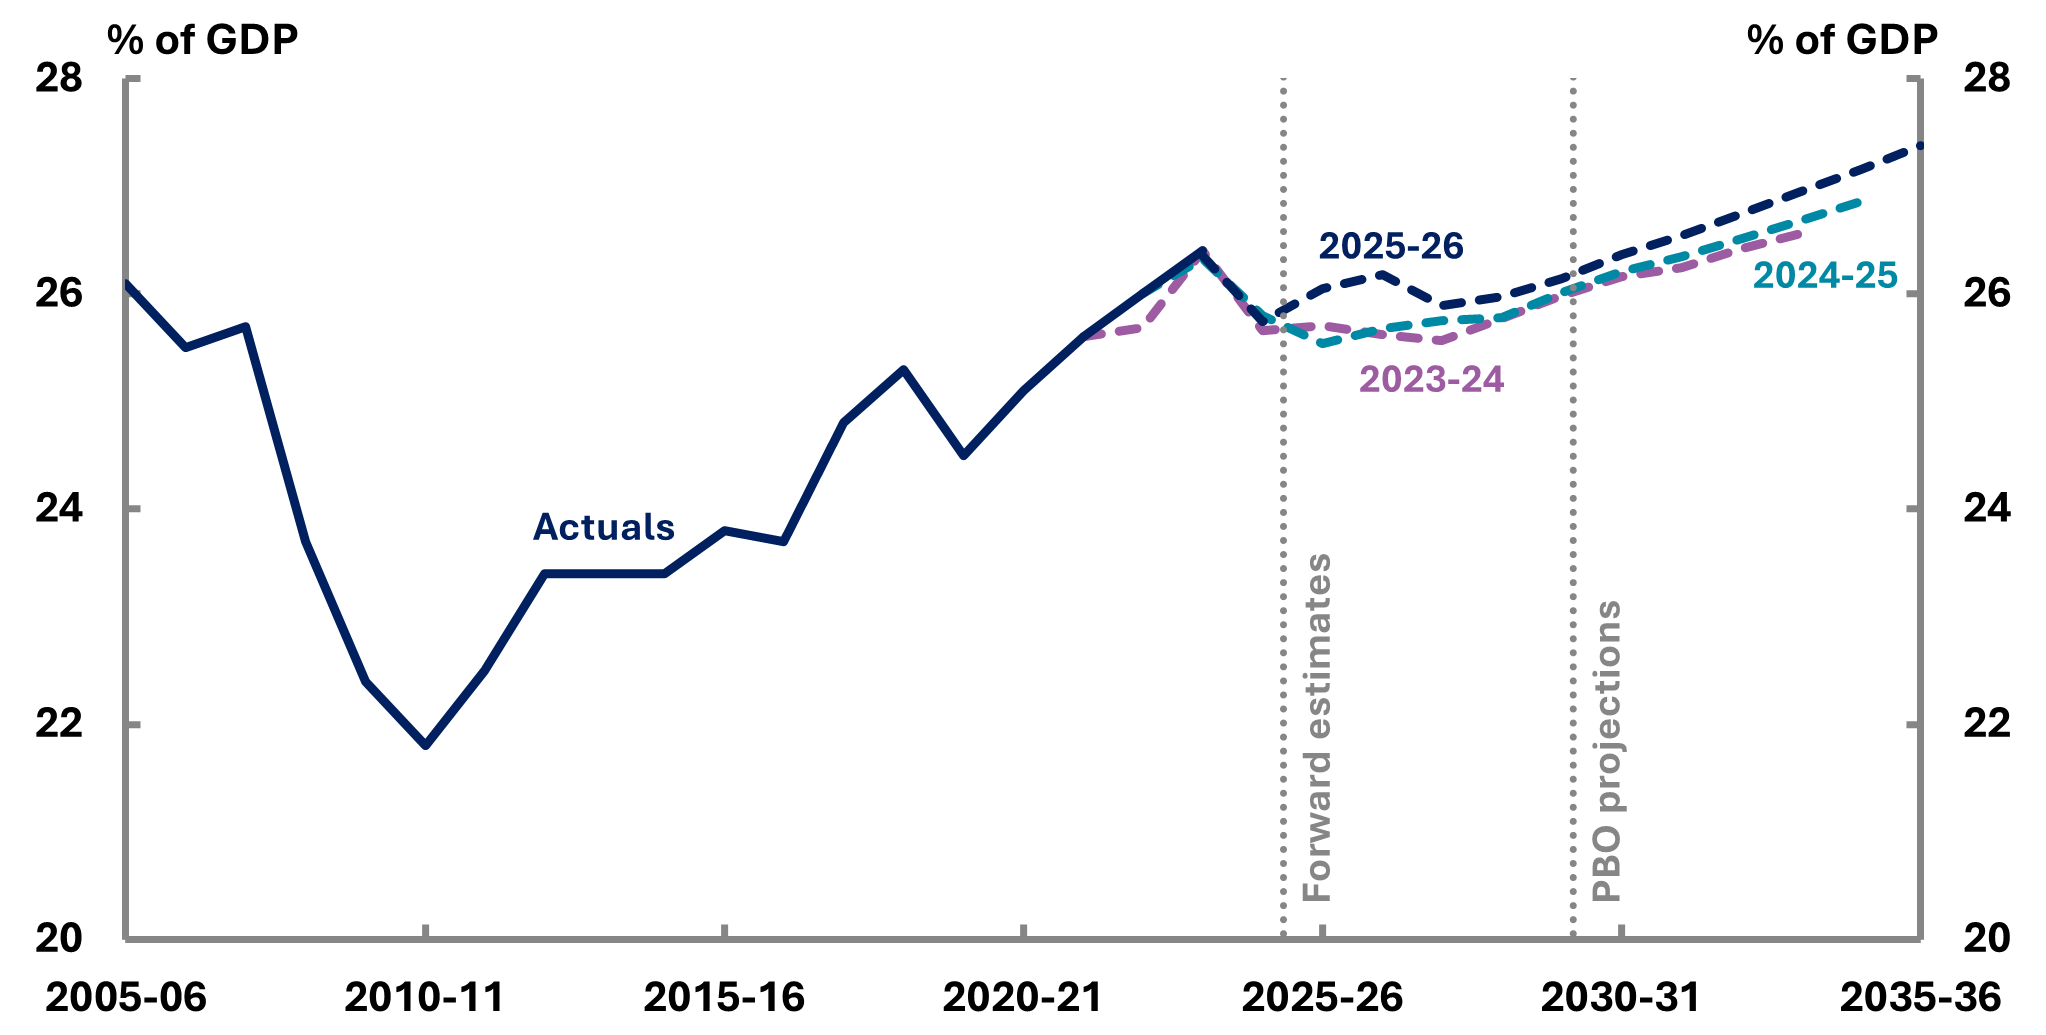
Source: 2023-24 Budget, 2024-25 Budget, 2025-26 Budget and PBO analysis.
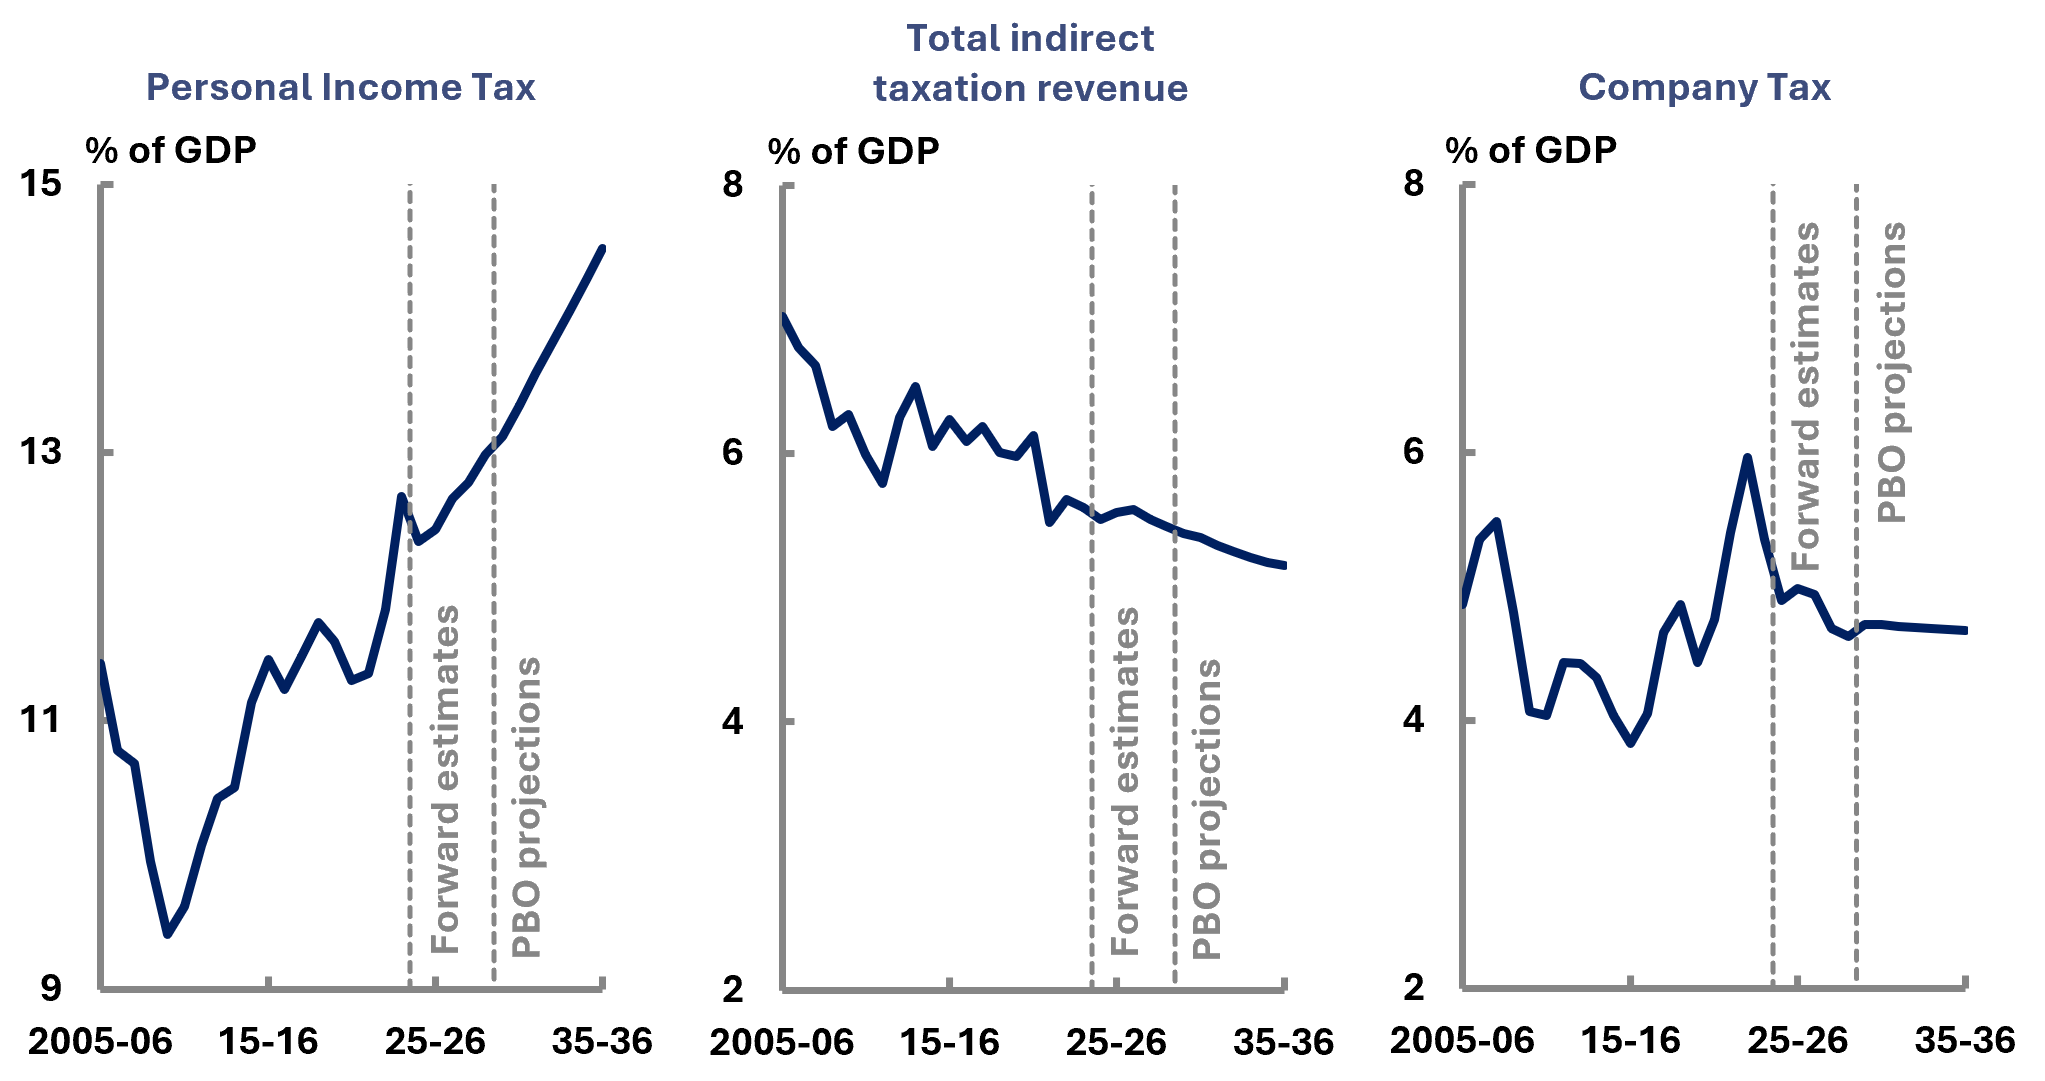
Government revenue is primarily made up of personal income tax (PIT), company tax, GST and other indirect taxes. Figure 5-2 shows the amount of each of these revenue streams as a share of GDP from 2010-11 to 2035-36.
- Personal income tax is the only revenue source projected to increase as a share of GDP over the medium term, growing to 14.5% of GDP by 2035-36, an increase of 4.9 percentage points since 2010-11. Section 5.3 – Personal income tax and bracket creep, further explores the changes to personal income tax and the impact of bracket creep.
-
Company tax is projected to decline from a high of 5.0% of GDP in 2025-26, with our projections stabilising at around 4.7% of GDP over the medium term. Company tax has fluctuated as a share of GDP since 2010-11. Company tax is forecast to decline from current elevated collections, as commodity prices are assumed to return to their long-run levels. For more information, please refer to section 5.4 – Company tax and commodity prices.
-
Indirect taxes are projected to be 0.8 percentage points lower as a share of GDP in 2035 36 compared to 2010-11. Indirect tax is projected to decline over the medium term primarily due to a decrease in excise revenue, with excise revenue revised downwards over the forward estimates. Tobacco excise has the largest downwards revisions (around $20.8 billion from 2024 25 to 2028-29) compared to $1.6 billion and $3.6 billion for fuel and alcohol excise respectively.
Figure 5-2: Tax revenue by type, 2005-06 to 2035-36
Source: 2025-26 Budget and PBO analysis.
In addition, GST is projected to decline slightly as a share of GDP over the medium term, while total indirect taxes, which includes GST and excise, are projected to decline from 5.6% of GDP in 2025-26 to 5.2% in 2035-36.[8]
Table 5-1 compares revenue sources with the largest movements between 2025-26 and
2035-36, as well as these changes as a share of GDP. All revenue estimates are expected to decline as a share of GDP, except the GST and personal income tax. Personal income tax is the largest driver for the increase in revenue over the forward estimates period and medium term.
The increase in superannuation guarantee to 12% will generate a slightly larger revenue from superannuation funds taxes. The superannuation guarantee percentage has gradually increased from 10% in 2021-22 to 12% from 1 July 2025 onwards.
While the increase in the superannuation guarantee leads to an increase in revenue, it is expected to have an overall net negative impact on total tax revenue. This is because greater superannuation contributions (taxed at lower rates) typically result in lower income tax from salary and wages.[9],[10] Looking further into the future, more assets in superannuation will also result in lower tax revenue from corporate income, as the dividends are taxed at a lower rate than if they were directly earned by individuals.
Personal income tax revenue continues to be the highest proportion of total revenue, increasing from 47.7% of revenue in 2025-26 to 53.0% in 2035-36. All other revenue sources are projected to decline as a share of total revenue.
Table 5-1: Comparison of revenue estimates
|
% of GDP |
$ billion |
% of revenue |
||||||
|---|---|---|---|---|---|---|---|---|
| 2025-26 | 2035-36 | Change | 2025-26 | 2035-36 | Change | 2025-26 | 2035-36 | |
| Personal income tax |
12.4 |
14.5 |
2.1 |
357.8 |
681.8 |
324.0 |
47.7 |
53.0 |
| Company tax |
5.0 |
4.7 |
-0.3 |
143.5 |
219.4 |
75.9 |
19.1 |
17.1 |
| Goods and services tax |
3.4 |
3.4 |
0.0 |
99.3 |
159.9 |
60.6 |
13.2 |
12.4 |
| Non-tax revenue |
1.9 |
1.9 |
0.0 |
56.0 |
89.5 |
33.5 |
7.5 |
7.0 |
| Total excise and customs duty |
1.5 |
1.2 |
-0.3 |
43.8 |
57.1 |
13.3 |
5.8 |
4.4 |
| Superannuation fund taxes |
0.9 |
0.9 |
0.0 |
25.6 |
42.1 |
16.5 |
3.4 |
3.3 |
| Other taxes and charges |
0.8 |
0.8 |
-0.1 |
24.3 |
35.7 |
11.3 |
3.2 |
2.8 |
| Total revenue |
26.1 |
27.4 |
1.3 |
750.3 |
1,285.5 |
535.2 |
100.0 |
100.0 |
Note: Total revenue includes taxation and non-taxation revenue. Other taxes and charges are all other revenue not included in the top 6 categories, including fringe benefits tax, resource rent taxes, the luxury car tax, wine equalisation tax and all other taxes and charges. Numbers may not sum due to rounding.
Source: 2025-26 Budget and PBO analysis.
For a full comparison of revenue estimates see Table B-1 in Appendix B.
Personal income tax revenue (Figure 5-3) is projected to increase from 12.4% of GDP in 2025-26 to 14.5% in 2035-36 primarily due to the continued impact of bracket creep. Personal income tax revenue projections are higher as a share of GDP than our 2024-25 projections by 0.1 percentage points in 2025-26, rising to 0.3 percentage points higher in 2034‑35.
Figure 5-3: Personal income tax revenue, 2005-06 to 2035-36
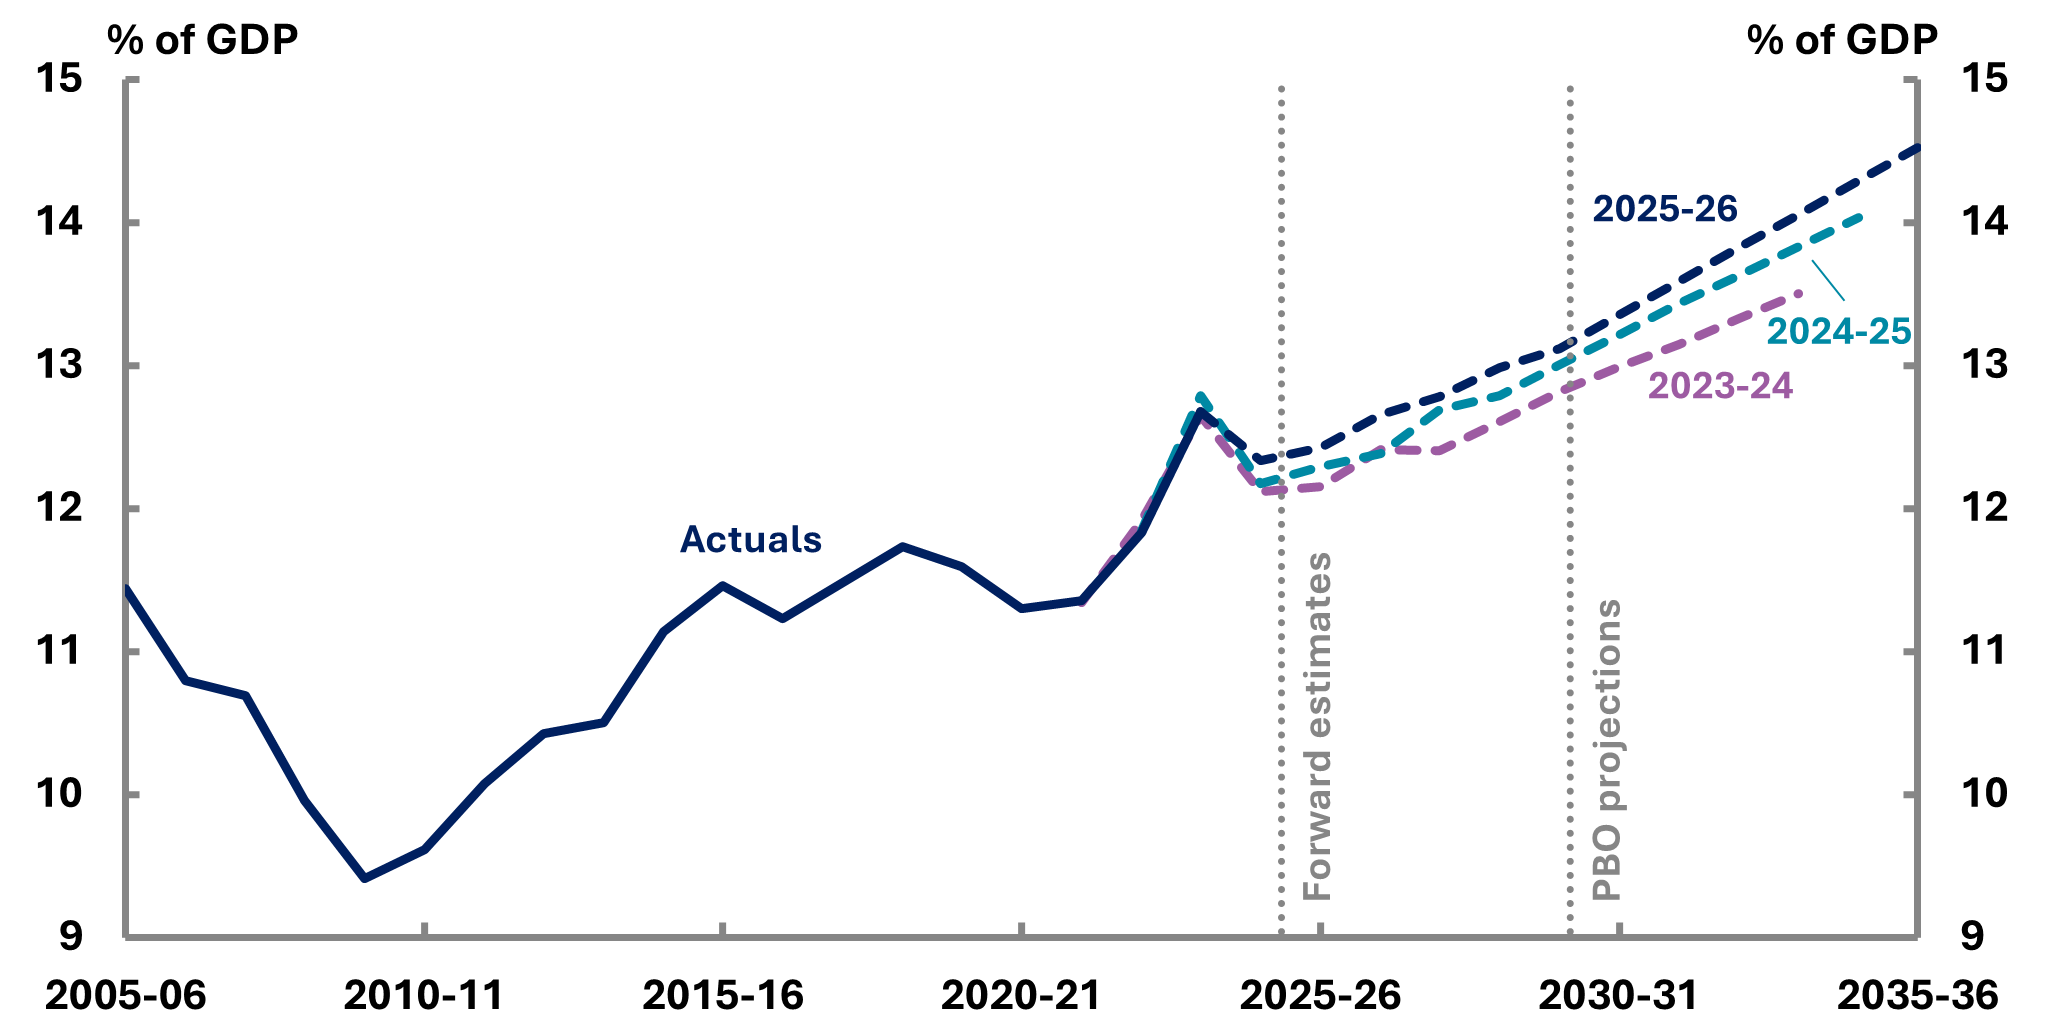
Figure 5-4 shows the average tax rate from 1960-61 to 2035-36 and where policy changes have impacted the average tax rate over time. By 2035-36 average tax rates are projected to reach their highest level, assuming no further tax cuts are legislated.
Bracket creep has played an important role in fiscal consolidation after previous major downturns, including the 1990s recession, the 2008-09 Global Financial Crisis and the COVID-19 pandemic. As wages rise nominally over time, individuals find themselves subject to higher marginal tax rates, boosting government revenue from personal income tax without any explicit policy change. This increase in tax is particularly notable in times of economic growth and inflation.
The PBO's budget explainer Bracket creep and its fiscal impact provides further detail on how bracket creep occurs and the effect on workers and the government’s fiscal position.
Without further income tax changes, bracket creep is projected to increase personal income tax revenue to 14.5% of GDP by the end of the medium term in 2035-36, which is 54% higher than in 2009-10, the lowest point since 2005-06.
The PBO's explainer Australia’s Tax Mix explores the history, taxation design principles and the impact of bracket creep in further detail.
Figure 5-4: Aggregate average personal income tax rate, 1960-61 to 2035-36
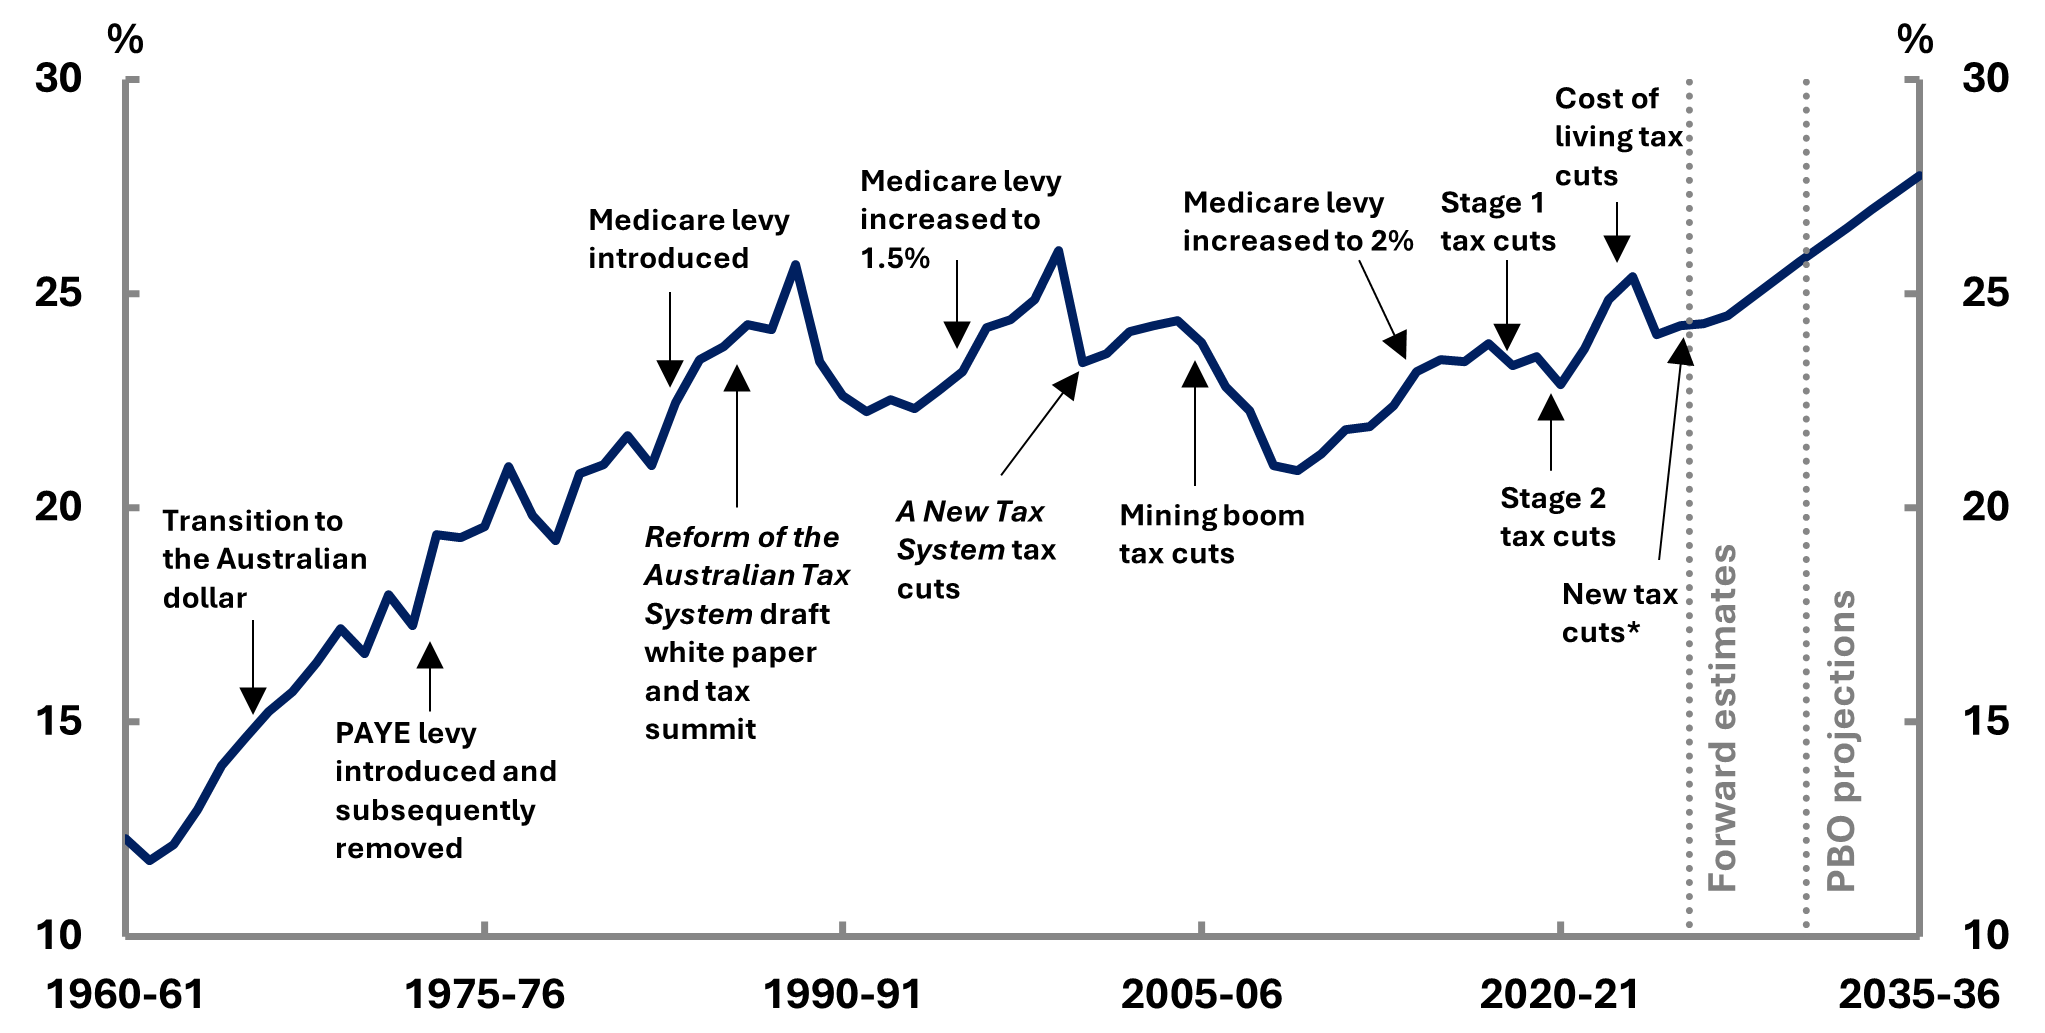
Note: For consistency across time, net tax before 2000-01 is calculated before allowance for franking credits. Data for non‑taxable individuals is unavailable prior to 1978-79. The net tax rate prior to 1978-79 assumes that taxable income for non‑taxable individuals has the impact of reducing the average tax rate by around 0.7 percentage points, the median amount from 1978-79 to 1987-88.
Source: ATO Taxation Statistics, 2025-26 Budget, and PBO analysis.
Increases in the average personal income tax rate, including our projections, reflect the impact of bracket creep, as wages grow and workers pay a higher proportion of their income to tax.
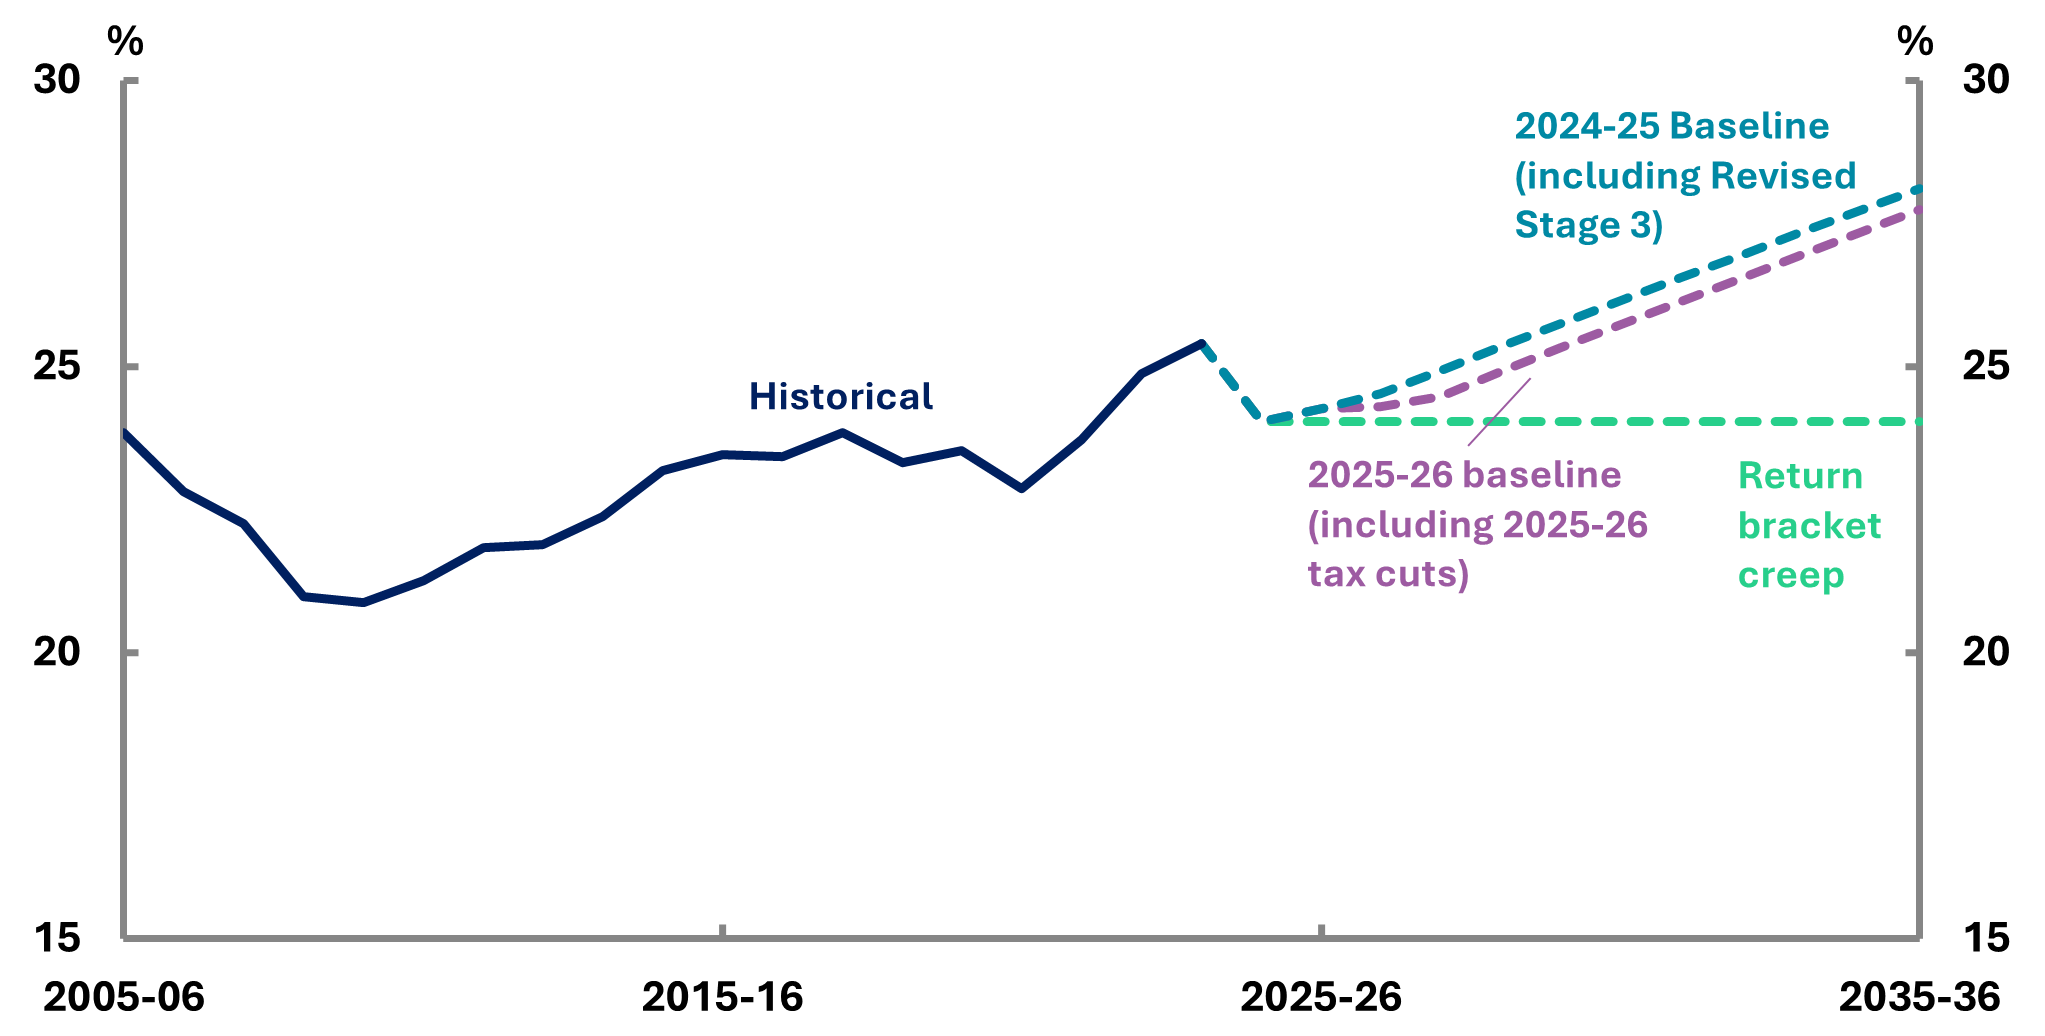
Recent tax cuts, including the revised Stage 3 cost of living tax cuts and the 2025-26 Budget measure Personal Income Tax – new tax cuts for every Australian taxpayer, have had a relatively small effect on average tax rates (Figure 5-5). The new tax cut will decrease the average tax rate by 0.4 percentage points by 2035-36. Associated thresholds are assumed to be unchanged in the future.
Figure 5-5: Aggregate average personal income tax rate including recent tax cuts, 2005 06 to 2035-36
Source: ATO Taxation Statistics, 2023-24 Budget, 2024-25 Budget, 2025-26 Budget and PBO analysis.
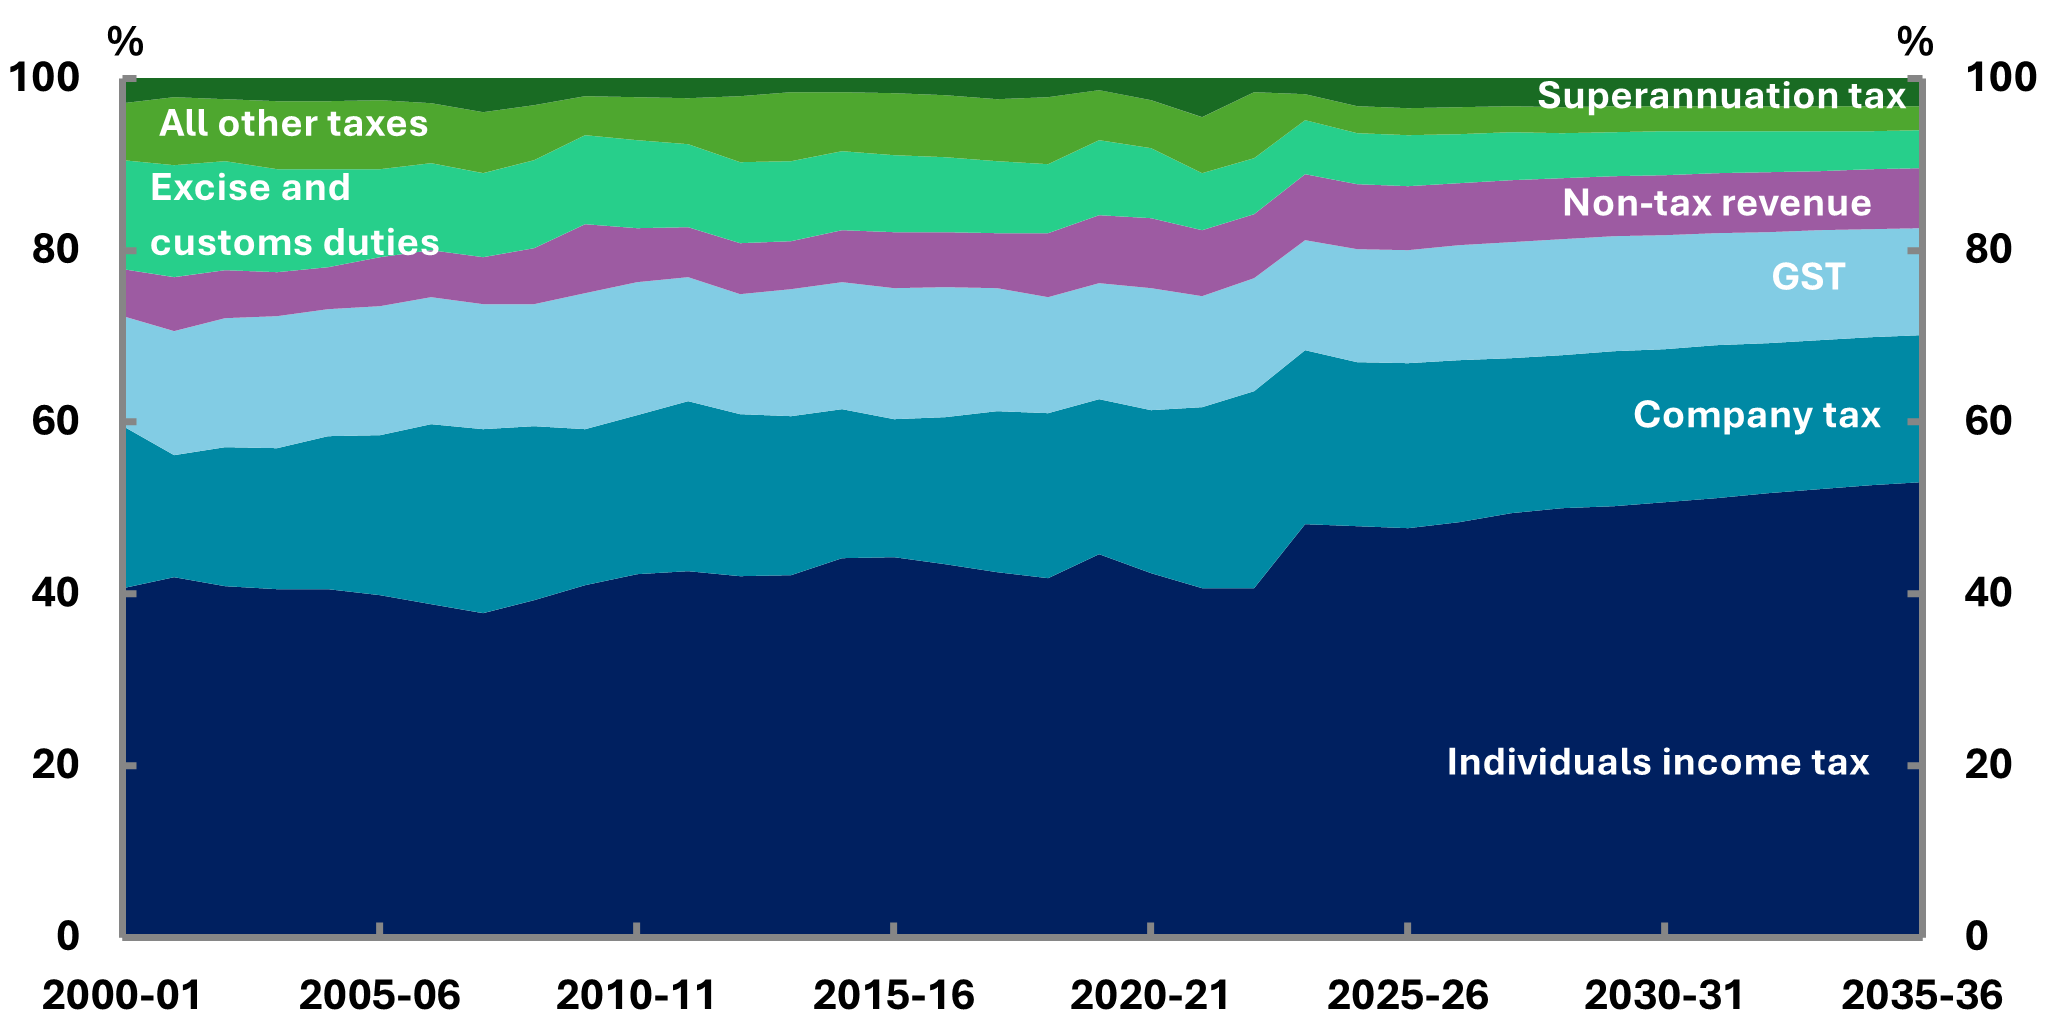
Figure 5-6 shows the overall tax base is projected to continue narrowing, with an increased reliance on personal income tax. This makes the budget more sensitive to changes in the composition of the economy and potentially widens the gap in effective tax rates between Australians at different stages of life.
The majority of personal income, particularly for younger workers, comes from wages and salaries, which are taxed relatively highly compared to capital income, including superannuation fund earnings. The latter has larger tax concessions compared to taxes on labour, with concessions on savings, particularly super and the capital gains tax discount, disproportionately benefitting higher income earners.[11]
The increasing reliance on personal income tax to balance the budget limits the government’s ability to provide relief from bracket creep, resulting in higher average tax rates for wage earners spreading the tax burden unevenly between generations (Figure 5-4). Box 2 explores the fiscal impact of limiting bracket creep.
This shift to increasing the burden on the tax mix to income derived primarily from labour poses equity challenges in the context of Australia’s ageing population. Older Australians, who are more likely to derive income from savings, investments, and superannuation, benefit disproportionately from lower taxes, while younger and working-age individuals bear a heavier tax burden on their labour. Older Australians are also more likely to have very low rates of financial stress, likely due to a combination of being more likely to own their own home, other wealth like superannuation, and lower expenditure needs.[12]
Figure 5-6: Revenue categories as a percentage of total revenue, 2000-01 to 2035-36
As people age, their contribution to income tax generally peaks around 40-49, then declines to less than 5% by the time they are over the age of 70. Compared to people born in the 1930s, progressive generations have been paying more personal tax income in their later years, possibly due to the higher retirement age and older workers staying in the workforce for longer. The curve is becoming steeper for people entering the workforce, with people taking longer to build up their earnings, but appearing to quickly catch up to the rates of previous generations.[13]
Fiscal sustainability is intertwined with intergenerational equity as future generations bear the burden of paying debt. As the population ages and other pressures on expenses increase the burden of maintaining fiscal sustainability through generating revenue will fall to future generations.
As the median age rises and more Australians enter retirement, government spending on age related services including age cared, health care and the aged pension, are projected to rise. The aged pension and aged care together are projected to comprise 14.0% of total government expenses by 2035-36, higher than the next highest categories of defence, interest and the NDIS (Table 6-1).
At the same time, a smaller working-age population will be expected to fund these growing expenses, primarily through personal income taxes. People over the age of 65 made up 9.6% of the population in 1980, rising to 12.5% of the total population in 2024-25, and projected to grow to 19.8% of total population by 2035-36. The population of people over 65 is projected to grow faster than the number of working people (15‑64).[14] In 1980, there was around 6.8 working aged people for every person aged over 65, by 2024-25 the number decreased to 3.7 and is projected further decline to 3.2 by 2034-35.[15]
The imbalance between a shrinking base of working-age people and higher demands on spending risks placing a large burden on future taxpayers, which could impact the long-term stability of public finances and the capacity to provide services across generations.
Bracket creep occurs when average tax rates rise due to income growth in a tax system with fixed thresholds. Due to the relatively large size of the income tax base, any change to personal income tax will have a disproportionate impact on the projected fiscal position of the budget.
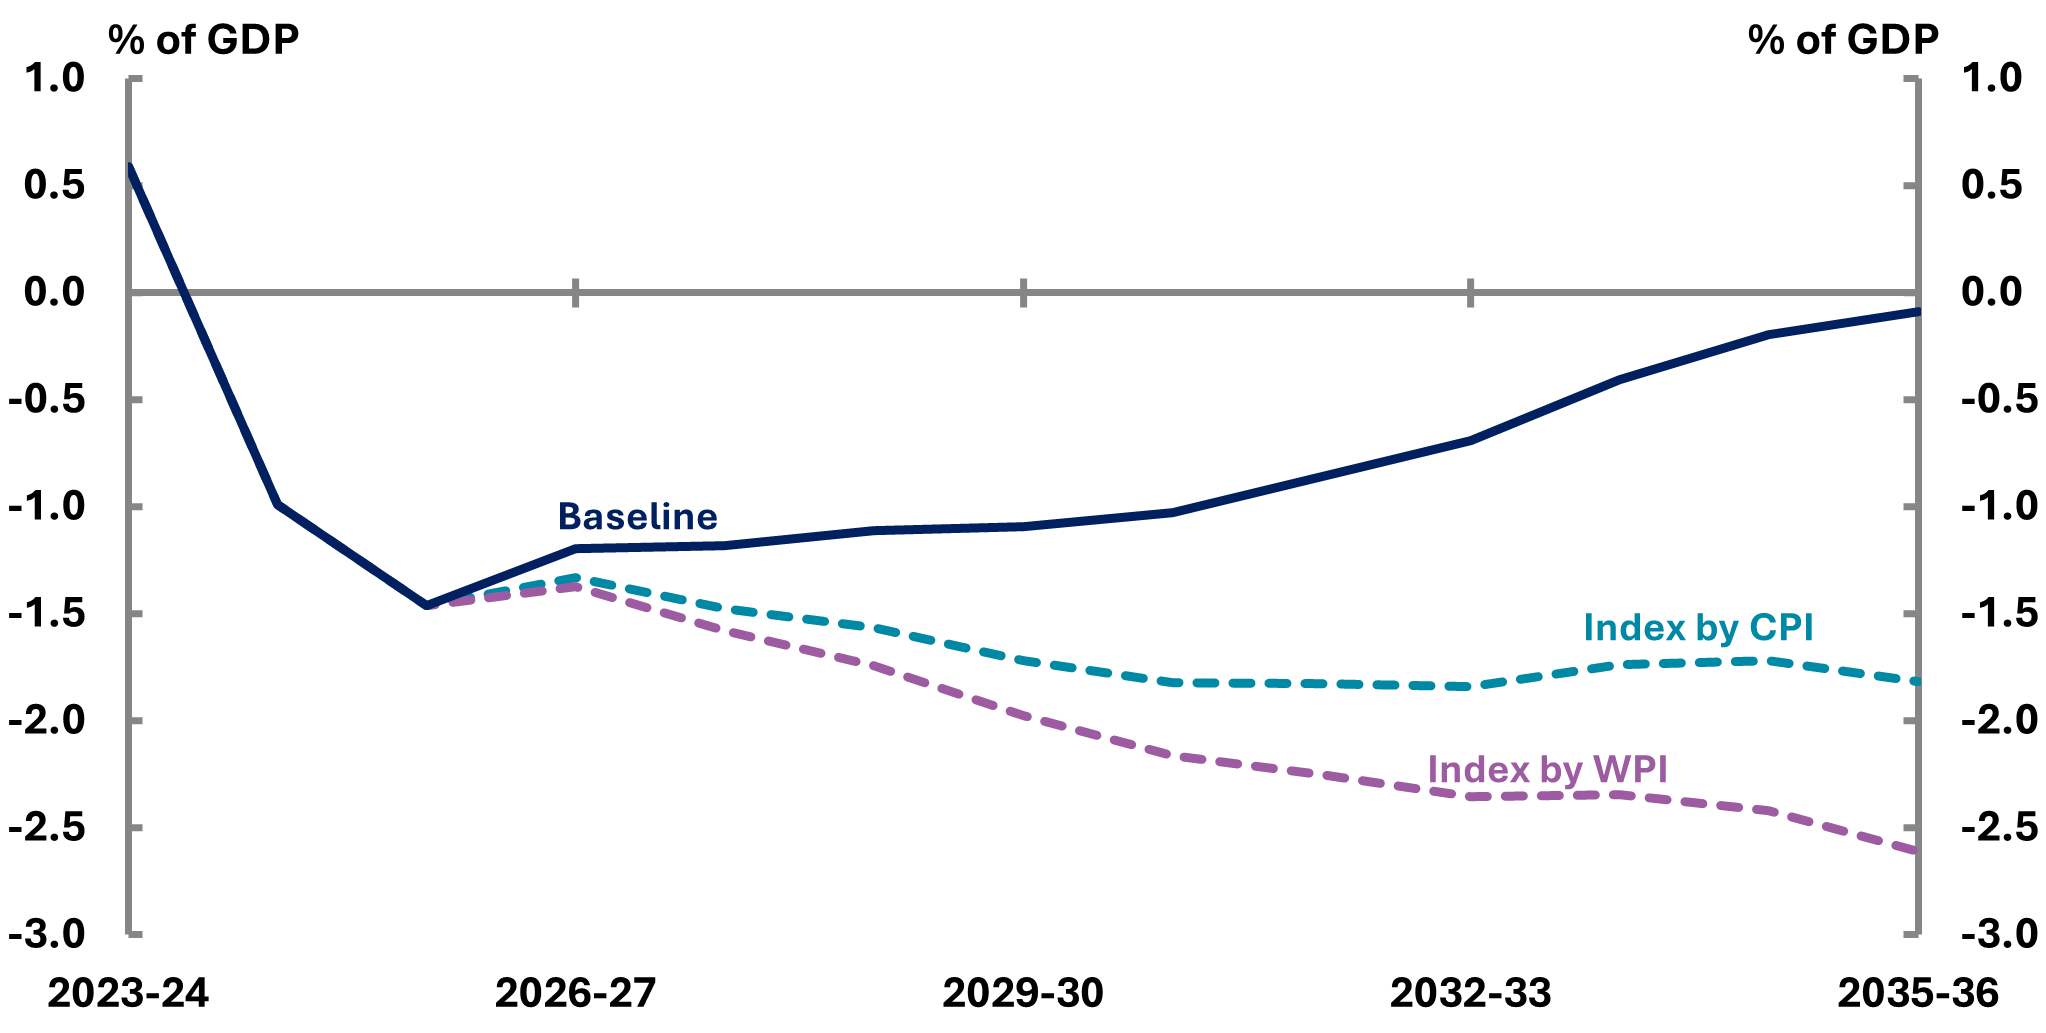
The budget projections rely on bracket creep for fiscal repair. Removing bracket creep through indexing income tax thresholds without a concurrent alternative revenue increase from one of the other revenue sources would have a significant deleterious effect on the budget. Figure 5-7 highlights the resulting budget deficits if bracket creep was eliminated without being replaced by another revenue source.
- The baseline projection estimates an average tax rate for individuals of 27.8% by the end of the medium term. Income tax revenue would increase from 12.4% as a share of GDP in 2025 26 to 14.5% as a share of GDP by the end of the medium term.
- If income tax thresholds were indexed by CPI each year this would not return the full amount of bracket creep as wages and other income tend to grow faster than CPI.
- Indexing income tax thresholds by WPI would largely return bracket creep.
In the baseline the UCB gradually improves, reaching a deficit of 0.1% of GDP in 2035 36. In both alternative scenarios the budget would not come close to a return to surplus, with an ongoing and increasing deficit each year to the end of the medium term in 2035-36, and beyond. By 2035-36, the deficit would be 1.8% of GDP with CPI indexation and even lower at 2.6% of GDP with WPI indexation and no alternative revenue source.
The PBO’s Build you own budget tool now allows users to index tax thresholds to either prices or wage.
Figure 5-7: Projected underlying cash balance, with and without limiting bracket creep, 2023-24 to 2035-36
At Federation, excise taxes comprised most of the commonwealth’s revenue. Following the advent of federal income taxes, excise has played a smaller but still important role in revenue raising.[16] In recent years, excise has frequently been characterised as playing a role in addressing externalities from the use of certain products. For example, fuel excise has been linked to road maintenance and tobacco excise linked to a disincentive for smoking.
Total excise revenue is projected to decline from 1.5% of GDP in 2025-26 to 1.2% of GDP in 2035-36. Over the past 40 years excise and customs revenue has decreased from around a quarter of total tax to around 5.8% in 2025-26 and is projected to fall to only 4.4% of tax over the next decade. The accelerating decline in excise revenue contributes to the increasing overall reliance on personal income tax.
Figure 5-8 compares the 2023-24, 2024-25 and 2025-26 projections of excise revenue. Despite increases to the tobacco excise rate, projected tobacco excise and equivalent customs duty revenue has declined significantly compared to our 2023-24 projections. This reflects a long-run trend of decreasing rates of consumption of tobacco that has been subject to excise, which have historically been offset by increases to the excise rate. The high excise rates appear to have also resulted in an increase in consumers switching to illicit tobacco, further depressing tobacco excise projections.[17]
Alcohol excise projections have been revised downward, reflecting decreasing consumption and the temporary freeze to some categories of alcohol excise rates from the 2025-26 Budget measure Supporting the Hospitality Sector and Alcohol Producers.
Figure 5-8: Excise revenue projections, 2015-16 to 2035-36
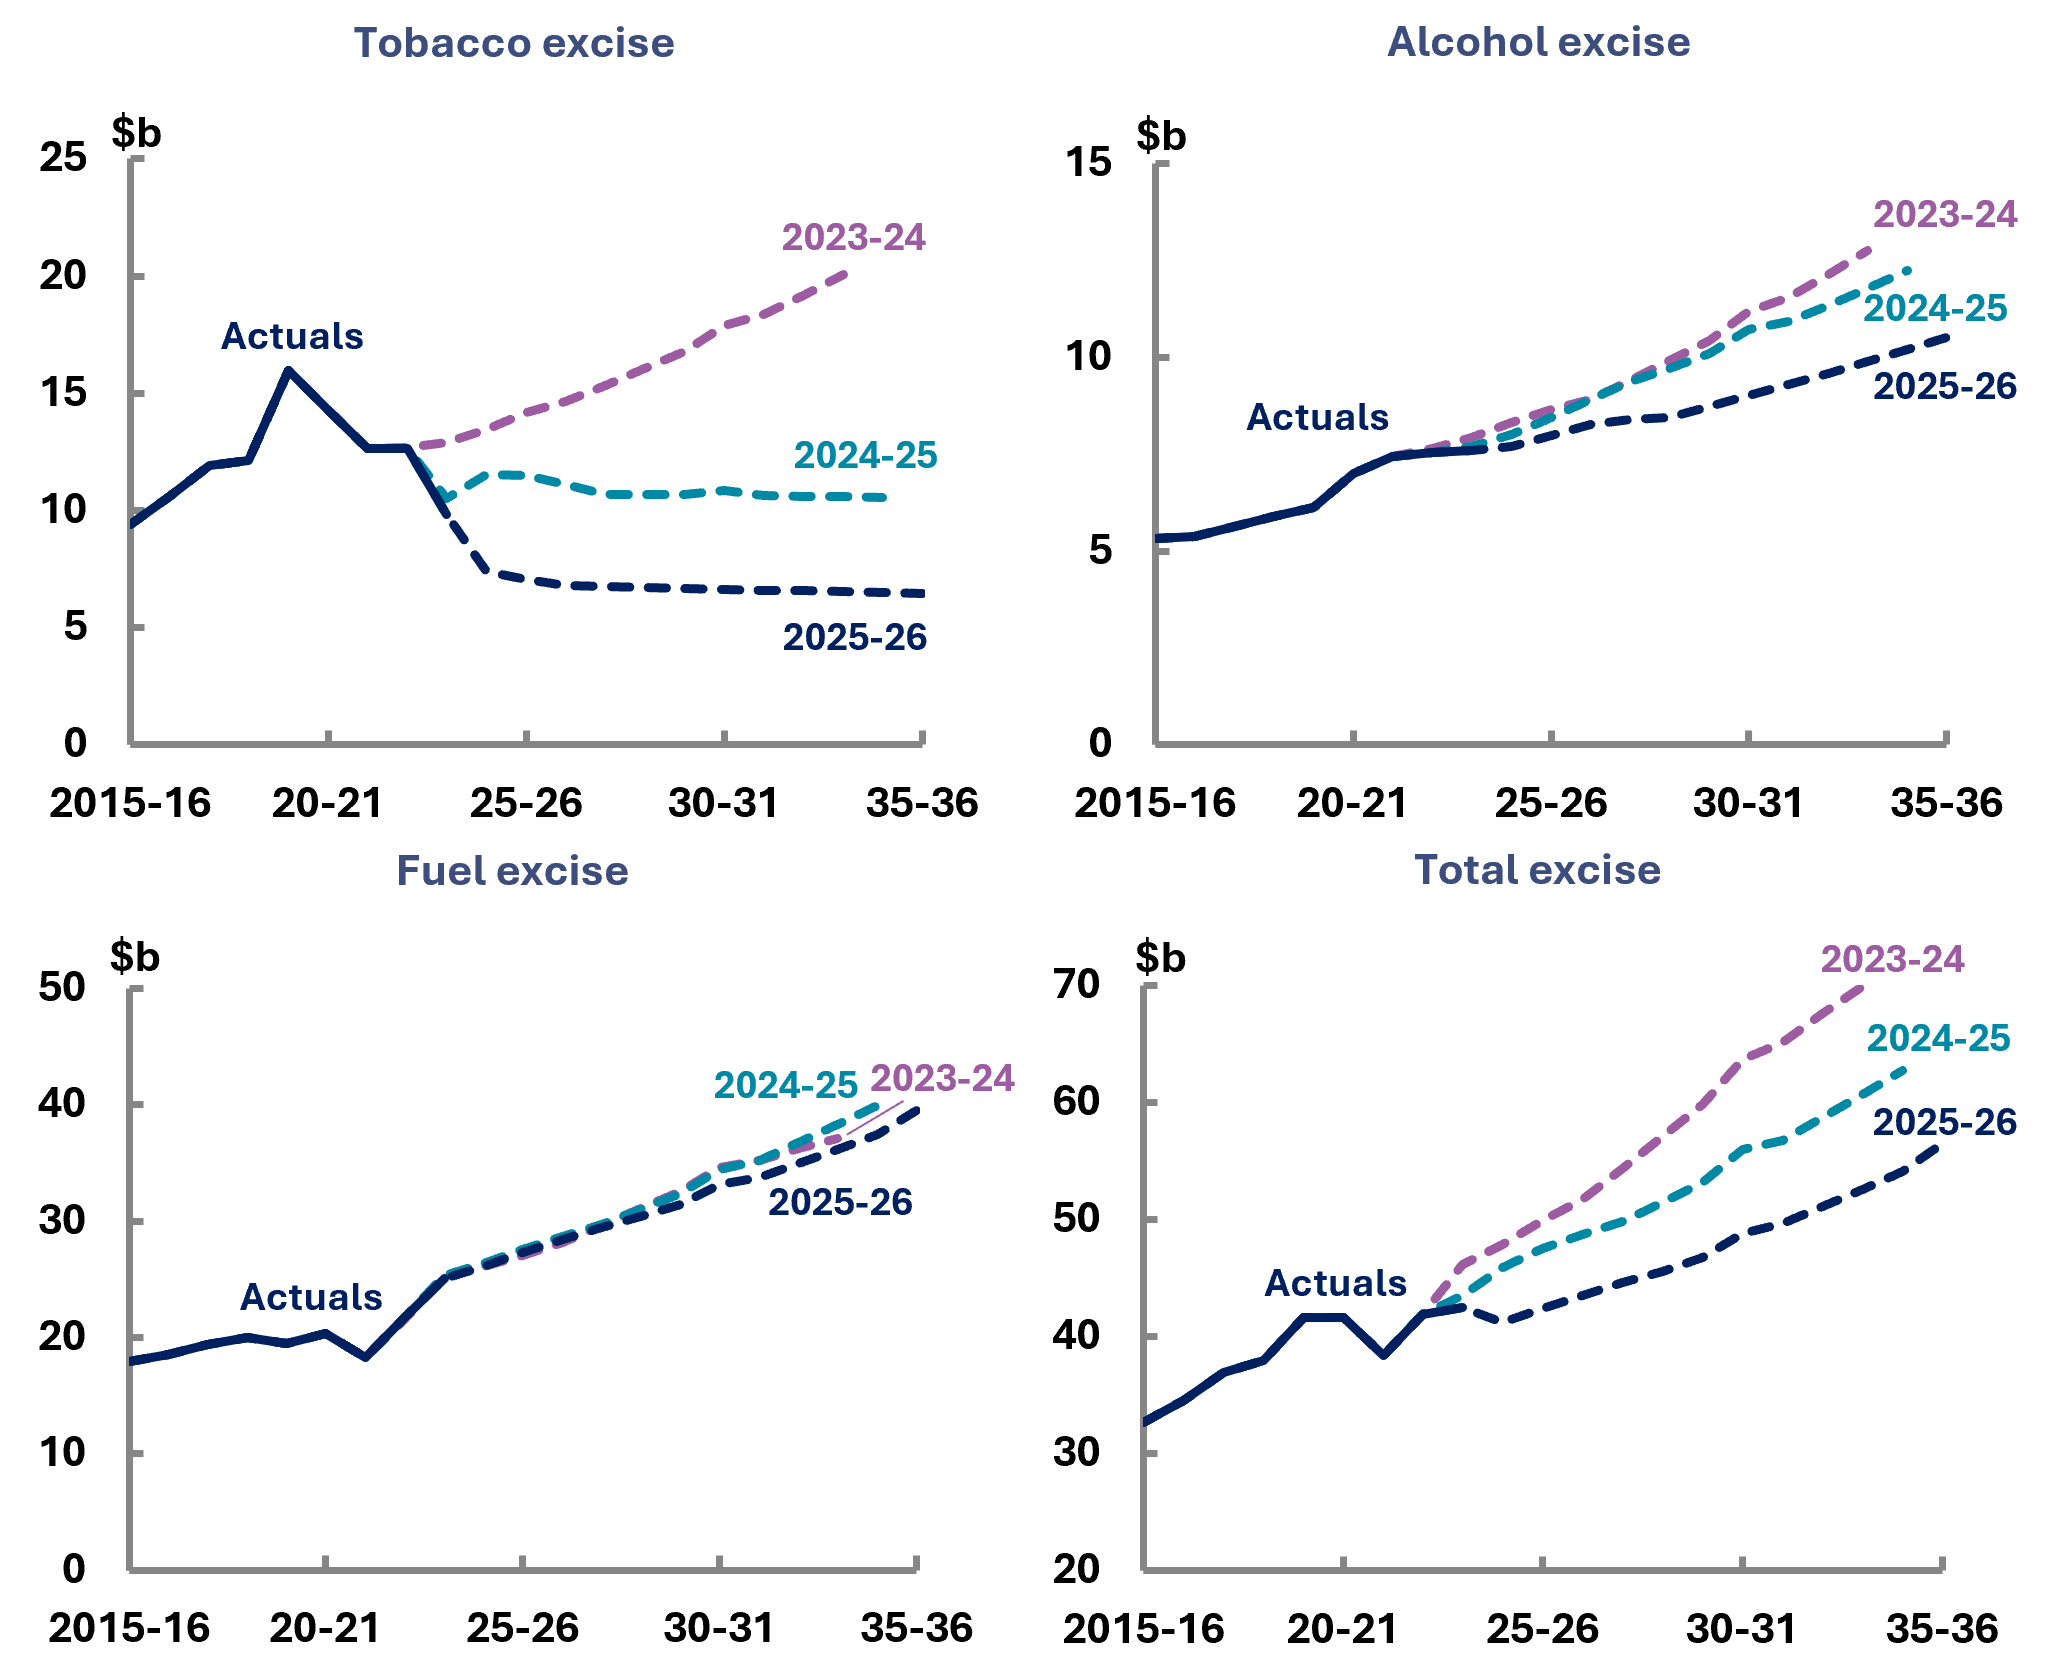
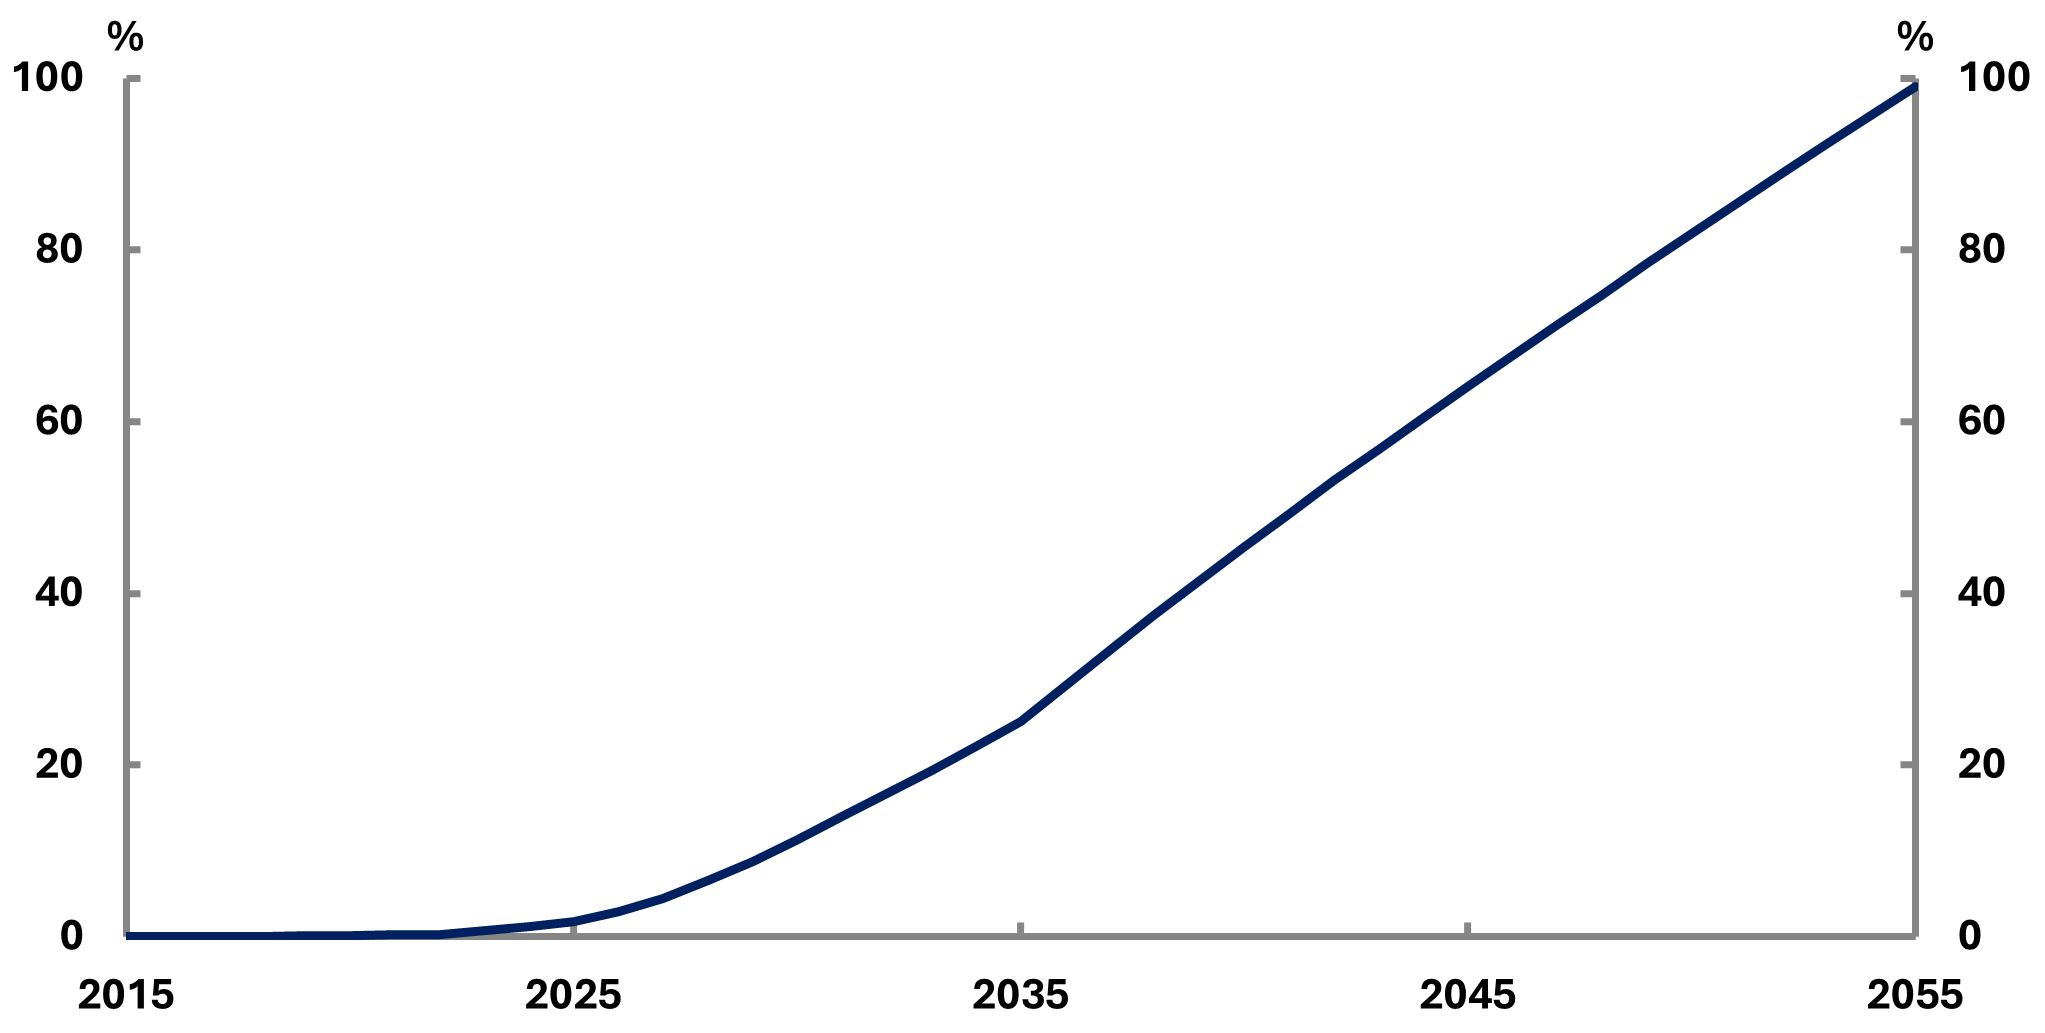
Fuel excise projections have declined by around 0.1% in 2025-26, rising to a 6.2% decrease in 2034-35 compared to our 2024-25 edition. This downwards revision reflects expected increased uptake of electric vehicles (EVs) will result in a long run decline in fuel excise. Although EV uptake in Australia is currently lower than other developed countries, the number of EVs purchased is expected to increase.[18] The CSIRO projected in their most likely scenario that EVs will gradually scale up from 1.8% of the total car fleet in 2025, to 25.1% in 2035 and reach nearly 100% by 2055 (Figure 5-9).[19] This would result in fuel excise collections (net of rebates) decreasing to nearly zero.
Figure 5-9: Electric vehicles as a share of total car fleet in Australia, 2015 to 2055
Over the past 20 years, fiscal volatility has often been linked to commodity prices flowing through to company tax receipts, which can benefit or be detrimental to the budget. Due to their unpredictability in the short term, budgets adopt a technical assumption that commodity prices will fall back towards a long-run level, although the precise path has varied over the years.
Surpluses in 2023-24 and 2024-25 were underpinned mainly by upwards revisions to commodity prices leading to an increase in company tax, combined with large upwards revisions to personal income tax and a decision to bank revenue. This post-COVID period was characterised by a degree of uncertainty over a number of underlying economic parameters and future fiscal volatility may be less pronounced (Figure 2-3). The 2025-26 Budget assumes that commodity prices and company tax will return to long-term trends.
Figure 5-10 shows the forecast commodity prices compared to the actuals over the past 10 years for iron ore, metallurgical coal and thermal coal. Over 10 years from 2015-16 to 2024 25, actuals were on average 56% higher than forecast.
Commodity prices and bracket creep have played an important role in budget repair. Box 3 explores the impact of commodity prices continuing to be higher than forecast in the budget and the effect over the forward estimates and medium term.
Figure 5-10: Key commodity prices, 2015-16 to 2024-25 (Budget forecasts compared to actuals)
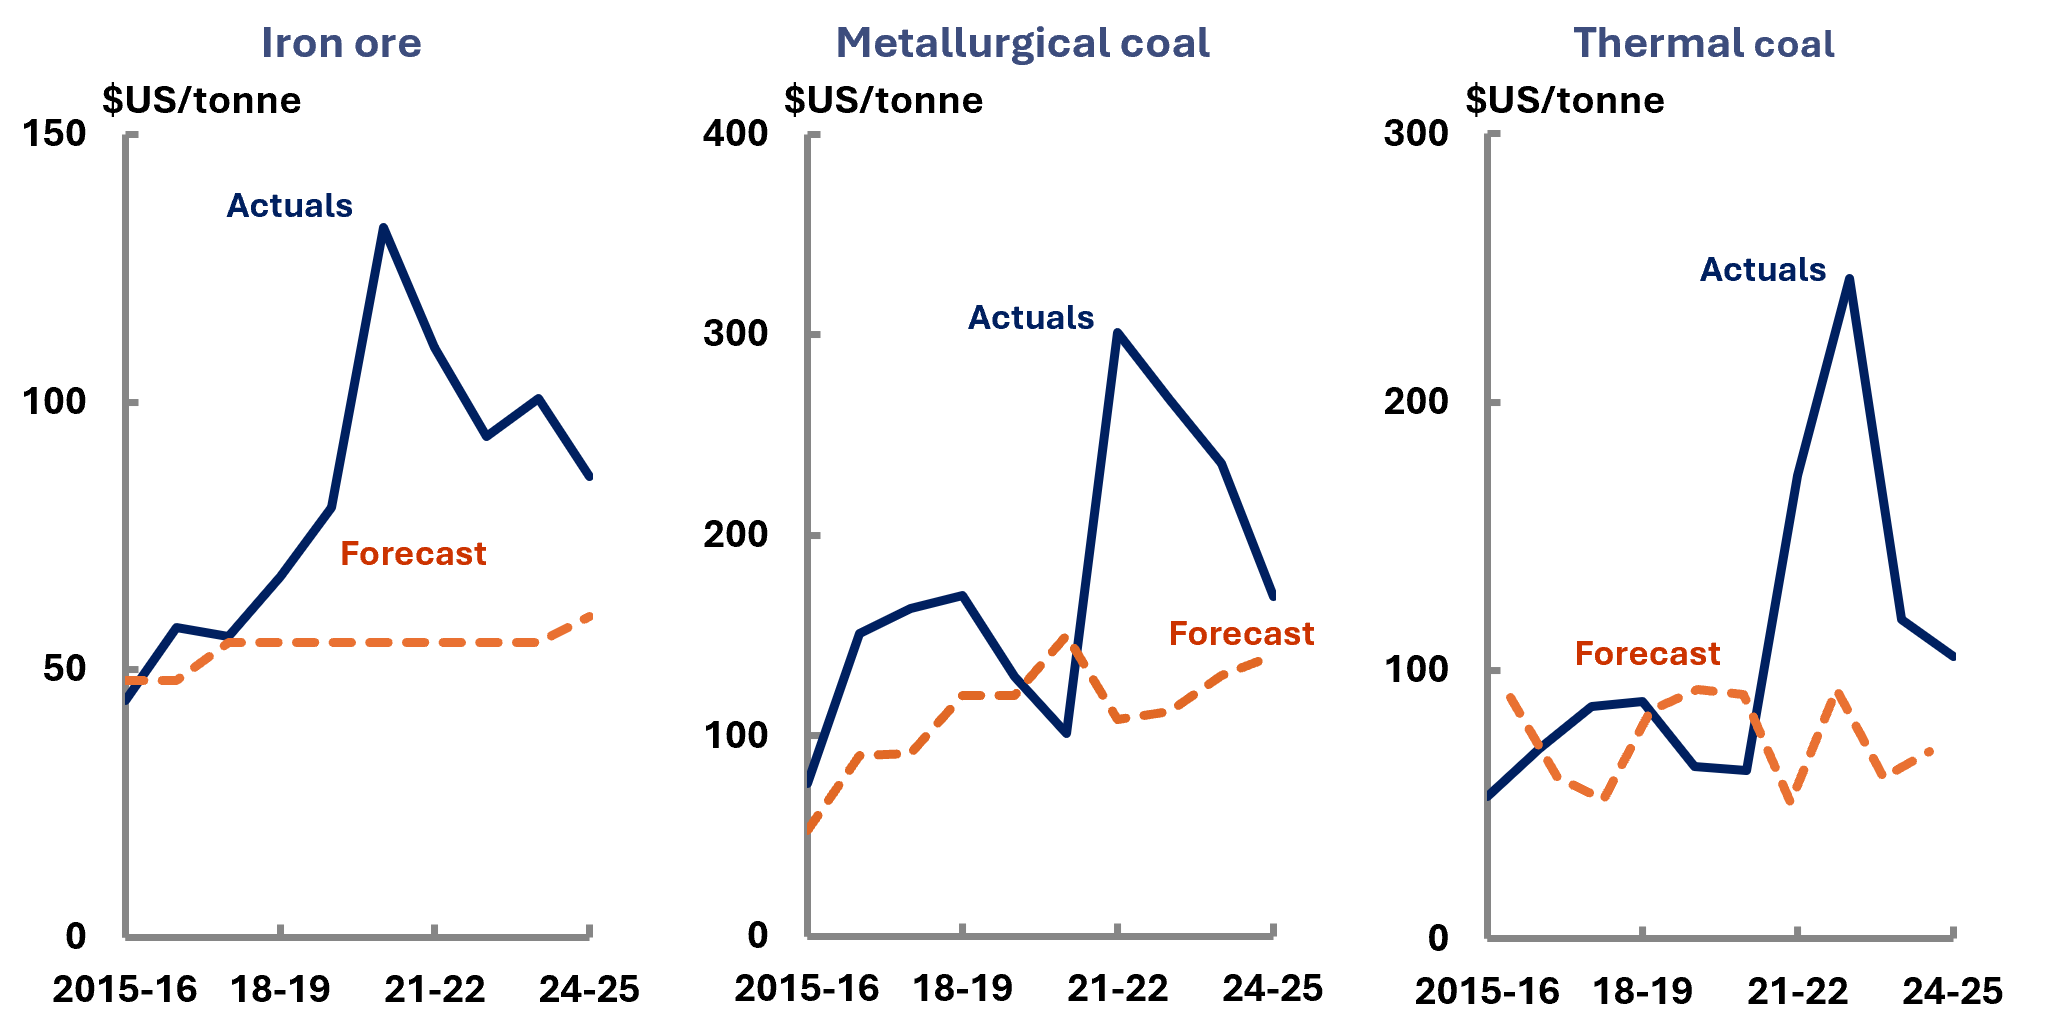
Source: Forecasts are taken from the 2014-15 Budget to 2025-26 Budget and PBO analysis, actuals are from Treasury.
Commodity prices have recently contributed to upwards revisions to company tax revenue in the budget through higher-than-forecast commodity prices. Conversely, lower than forecast commodity prices can negatively impact the budget. The surpluses in 2023-24 and 2024-25 were primarily due to commodity prices exceeding forecasts and upwards revisions to personal income tax.
Figure 5-11 presents the current baseline scenario for the budget, where the UCB deficit is projected to be 0.1% of GDP by the end of the medium term, with alternate scenarios of higher commodity prices leading to a faster return to surplus.
- Our baseline projection estimates company tax revenue to decrease from 5.0% as a share of GDP in 2025-26 to 4.7% by the end of the medium term in 2035-36 due to commodity prices coming back down from prior highs.
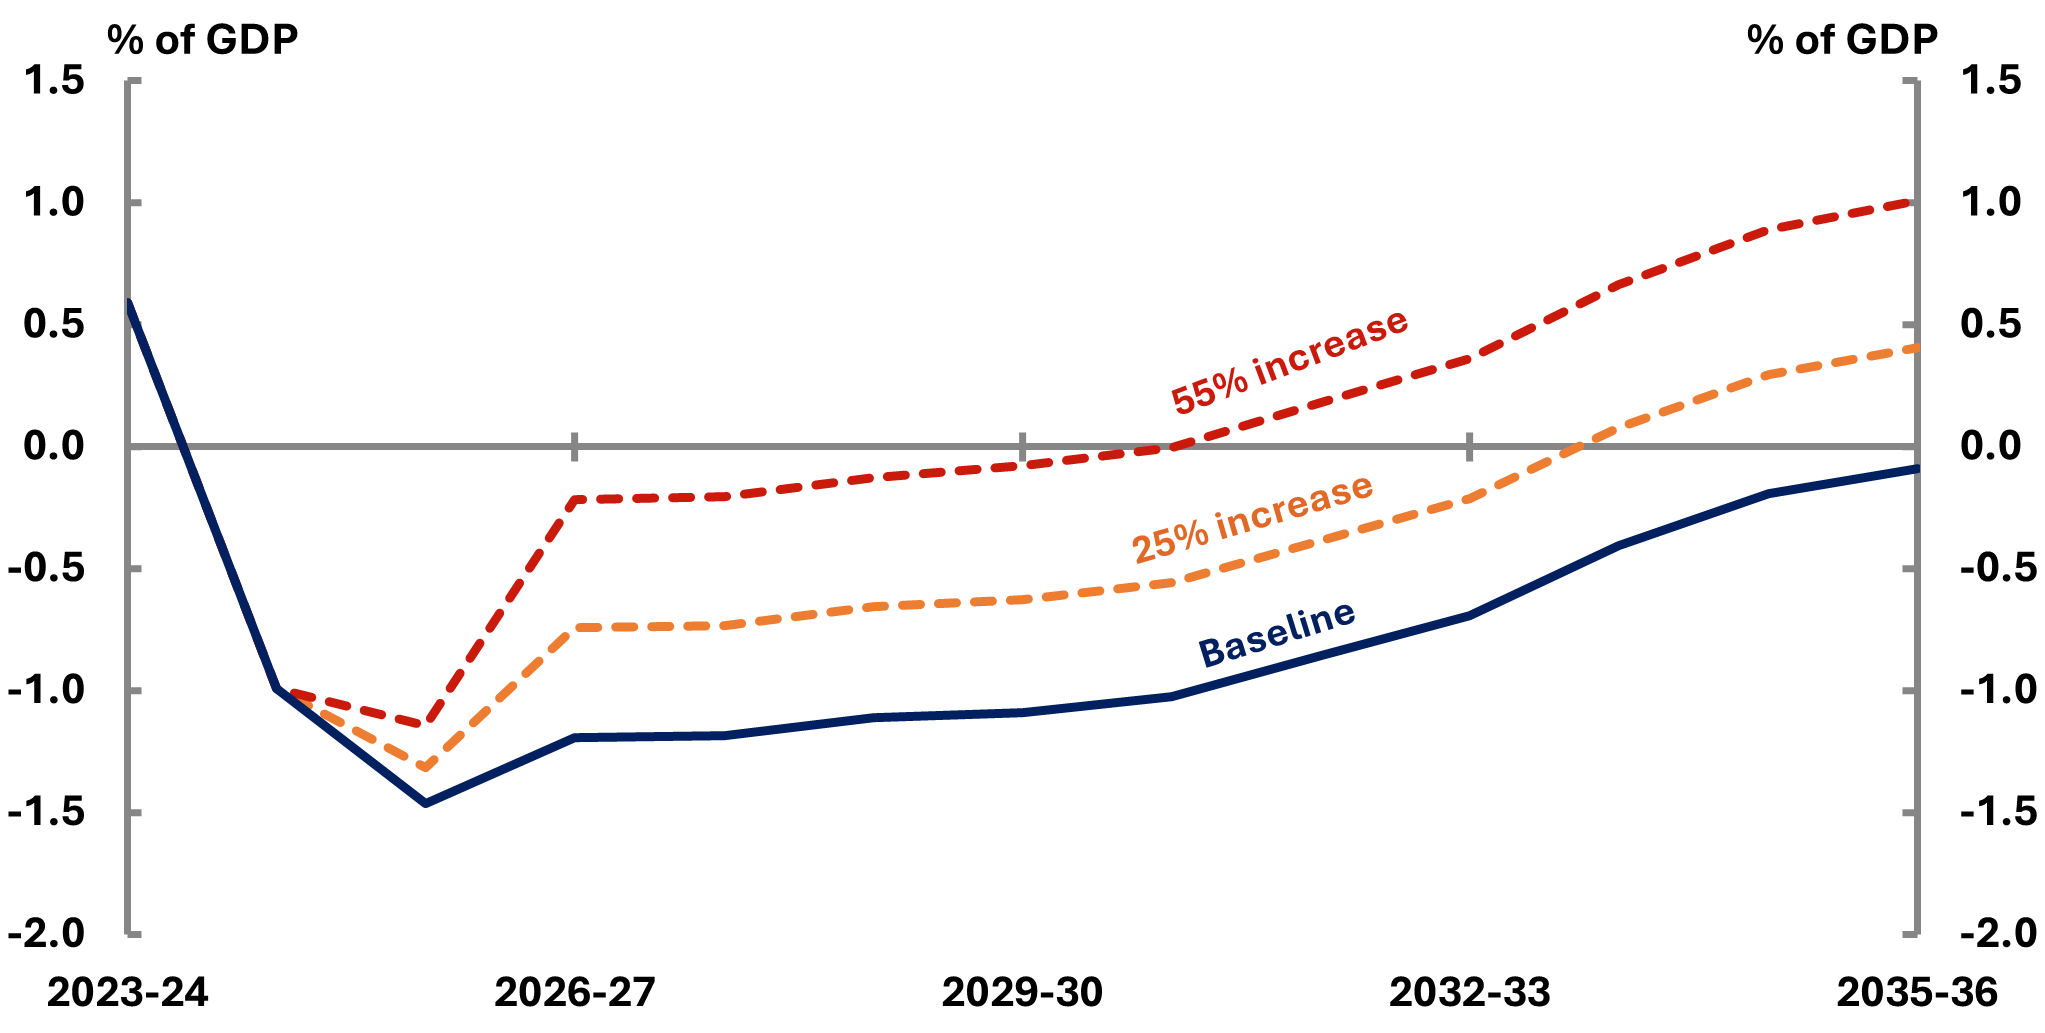
- The first scenario increases the price of commodities (including iron ore, coal, and gas) by 25%.
- The second scenario increases the price of commodities by 55%, around the 10-year average difference between commodity price forecasts in the budget and actuals. Notably, recent budgets have not included significant upgrades.
In both scenarios, the budget would be returned to surplus within the decade. The second scenario would result in a faster return to surplus compared to the baseline and the first scenario, with ongoing surpluses from 2031-32.
Figure 5-11: Projected underlying cash balance, increasing commodity price forecasts, 2023-24 to 2035-36
6 Expenses
- This chapter presents our projections for the main expense categories that determine the budget aggregates.
- Total expenses are projected to be relatively stable as a share of GDP across the medium term but have risen compared to the previous 2 editions of Beyond the budget.
- NDIS growth forecasts have moderated slightly in the 2025-26 Budget but the NDIS is still a large contributor to total expenses growth, along with defence spending and interest payments.
- Grants and public service expenses have been historically underestimated and could turn projected budget surpluses into deficits by the end of the medium term.
Total expenses (Figure 6-1) are projected to be relatively stable at around 27% share of GDP across the medium term, albeit higher compared to the projections of the past 2 publications.
Compared to the 2024-25 edition, total expense projections have increased by an average 0.6% of GDP over the forward estimates and 0.7% of GDP over the remainder of the medium term. In the 2025-26 Budget, policy decisions were estimated to increase expenses by $16.2 billion over the 4 years from 2024-25 to 2027-28 compared with the 2024-25 MYEFO,[20] contributing to the upward revision in the total expense relative to the 2024-25 projections.
Figure 6-1: Total expenses, 2005-06 to 2035-36
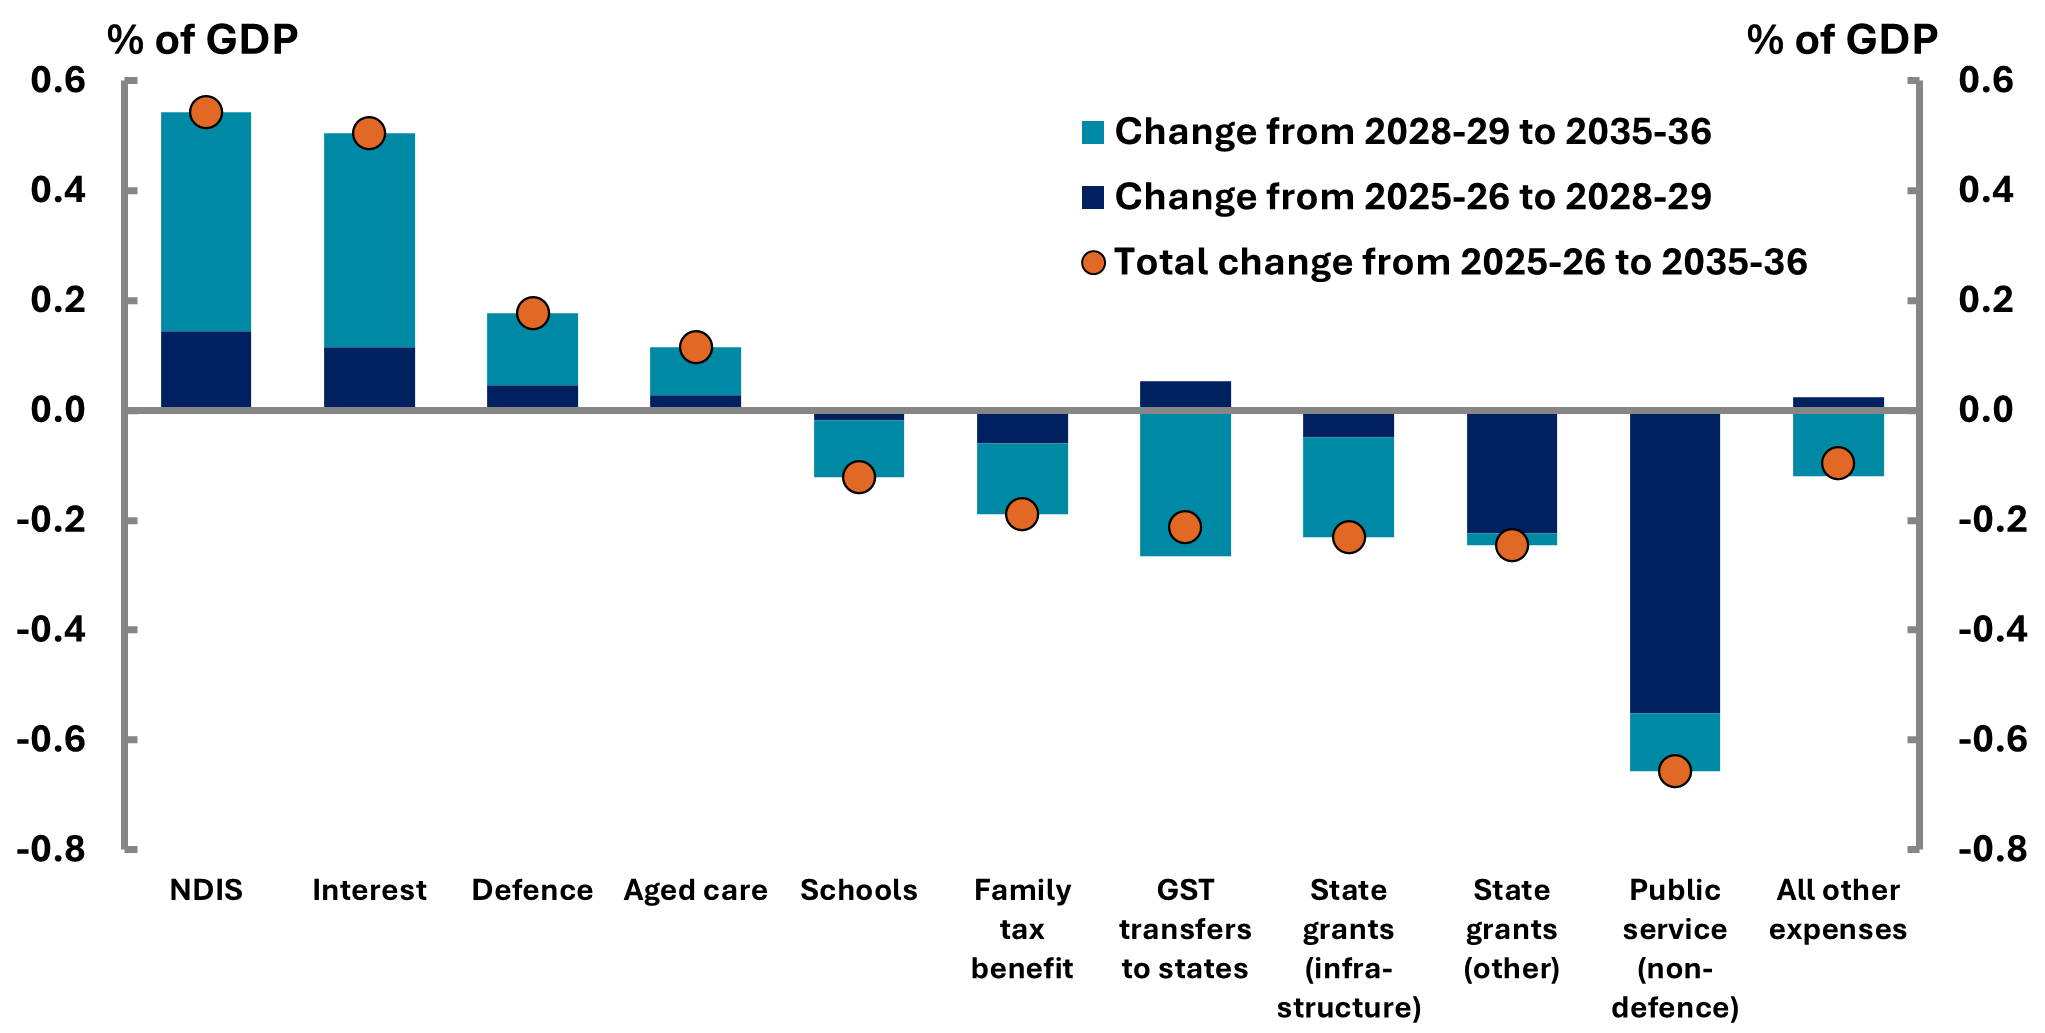
Expenses are projected to remain relatively stable as a share of GDP over the medium term. Three large programs (NDIS, defence, interest expenses) are growing much faster than GDP, but these are offset by several programs projected to decline.
Figure 6-2 shows the programs with the largest movements in expenses as a percentage of GDP across the forward estimates and the medium term. The NDIS continues to be the main driver of growth in expenses as a share of GDP over the medium term, followed by interest expenses and defence.
The cost of the commonwealth public service contributes most to reductions in expenses (see section 6.5), mostly in the next few years, followed by several categories of assistance to the states and territories.
Figure 6-2: Changes in expenses, 2025-26 to 2035-36
Source: 2023-24 Budget, 2024-25 Budget, 2025-26 Budget and PBO analysis.
Table 6-1 shows the expense programs with the largest movements between 2025-26 and 2035‑36, as well as the change as a percentage of GDP. Expenditure on GST transfers to the states and territories remains the largest individual expense program but is expected to decrease as a percentage of GDP across the medium term.
Similar to the previous editions of Beyond the budget, NDIS, interest payments, defence, Age Care have the greatest increase as a percentage of GDP while the spending on grants, particularly to the states and territories, and the cost of the public service are the main contributor to expenditure restraint. Grant funding and other general government operating costs (‘departmental expenses’) are discussed further in section 6.5 of this report.
Table 6-1: Comparison of largest expense programs in the 2025-26 Budget (top 10)
|
% of GDP |
$ billion |
% of expense |
|||||
|---|---|---|---|---|---|---|---|
|
2025-26 |
2035-36 |
Change |
2025-26 |
2035-36 |
Change |
2035-36 |
|
| GST transfers to states |
3.5 |
3.3 |
-0.2 |
100.1 |
153.2 |
53.1 |
12.1 |
| National Disability Insurance Scheme |
1.7 |
2.3 |
0.5 |
49.8 |
106.7 |
56.8 |
8.5 |
| Age pension |
2.3 |
2.2 |
0.0 |
65.0 |
105.2 |
40.2 |
8.3 |
| Defence |
1.9 |
2.1 |
0.2 |
55.5 |
98.8 |
43.3 |
7.8 |
| Interest on debt |
1.3 |
1.8 |
0.5 |
38.7 |
86.7 |
48.0 |
6.9 |
| Aged care |
1.4 |
1.5 |
0.1 |
41.1 |
72.3 |
31.3 |
5.7 |
| Public hospitals |
1.2 |
1.3 |
0.1 |
34.0 |
60.4 |
26.4 |
4.8 |
| Medicare Benefits Schedule |
1.2 |
1.3 |
0.1 |
35.2 |
60.1 |
24.9 |
4.8 |
| Public service (non-defence) |
1.9 |
1.2 |
-0.7 |
54.4 |
57.8 |
3.5 |
4.6 |
| Schools and higher education |
1.2 |
1.1 |
-0.1 |
34.6 |
49.8 |
15.2 |
3.9 |
| All other expenses |
9.6 |
8.7 |
-0.9 |
277.4 |
410.4 |
136.5 |
32.5 |
| Total revenue |
27.3 |
26.9 |
-0.4 |
785.7 |
1,261,4 |
479.2 |
100.0 |
Notes: Amounts shown here are not identical to those shown in the 2025-26 Budget Paper No 1 (table 5.3.1) owing to small definitional differences. NDIS includes additional administration expenses and will be slightly higher than figures in the Interactive analysis – net operating balance, revenue and expenses chart and the PBO’s Build your own budget tool.
Source: 2024-25 Budget, 2025-26 Budget and PBO analysis.
The programs presented here are a combination of forward estimates in the 2025-26 Budget and PBO projections across the medium term. For a full comparison of expense programs, refer to Table B-2 in Appendix B.
During the initial years of the NDIS, spending fell short of expectations as the scheme took longer than assumed to establish. Since then, spending on the NDIS has consistently exceeded expectations. For example, the NDIS cost $42 billion in 2023-24, 72% more than originally budgeted at the 2020-21 Budget.
In April 2023, before the 2023-24 Budget, National Cabinet agreed to the NDIS Financial Sustainability Framework, aimed at limiting scheme growth to no more than 8% per year by 1 July 2026. Since then, the cost of the NDIS has continued to grow quickly but has been close to the forecasts and the continual upward revisions have ceased. The cost of the NDIS for 2024‑25 was about $46 billion, around 2% higher than forecast after the establishment of the Framework,[21] and estimates for later years have been revised down (Table 6-2).
It is still uncertain whether the scheme will achieve the 8% growth target, but recent growth in NDIS expenditure is showing signs of moderation.
Table 6-2: Change in NDIS scheme expenditure estimates since the 2017-18 Budget ($ billion, actuals in bold)
| Year |
16-17 |
17-18 |
18-19 |
19-20 |
20-21 |
21-22 |
22-23 |
23-24 |
24-25 |
25-26 |
26-27 |
27-28 |
28-29 |
|---|---|---|---|---|---|---|---|---|---|---|---|---|---|
| 2017-18 Budget % growth |
3.7 |
9.1 |
15.8 |
19.1 |
20.4 |
|
|
|
|
|
|
|
|
| 2018-19 Budget % growth |
2.2 |
6.7 |
15.1 |
19.4 |
21.1 |
22.3 |
|
|
|
|
|
|
|
| 2019-20 Budget % growth |
|
5.4 |
11.8 |
16.3 |
20.9 |
22.1 |
23.4 |
|
|
|
|
|
|
| 2020-21 Budget % growth |
|
|
10.5 |
17.6 |
21.7 |
23.8 |
24.0 |
24.3 |
|
|
|
|
|
| 2021-22 Budget % growth |
|
|
|
23.4 |
23.3 |
26.5 |
28.3 |
29.4 |
31.9 |
|
|
|
|
| 2022-23 Budget % growth |
|
|
|
|
23.3 |
29.3 |
33.9 |
38.0 |
41.4 |
44.6 |
|
|
|
| 2023-24 Budget % growth |
|
|
|
|
|
28.6 |
35.1 |
40.0 |
45.3 |
50.3 |
54.4 |
|
|
| 2024-25 Budget % growth |
|
|
|
|
|
|
35.2 |
42.4 |
46.4 |
50.8 |
54.9 |
59.3 |
|
| 2025-26 Budget % growth |
|
|
|
|
|
|
|
41.9 |
46.2 |
49.8 |
53.7 |
57.6 |
62.2 |
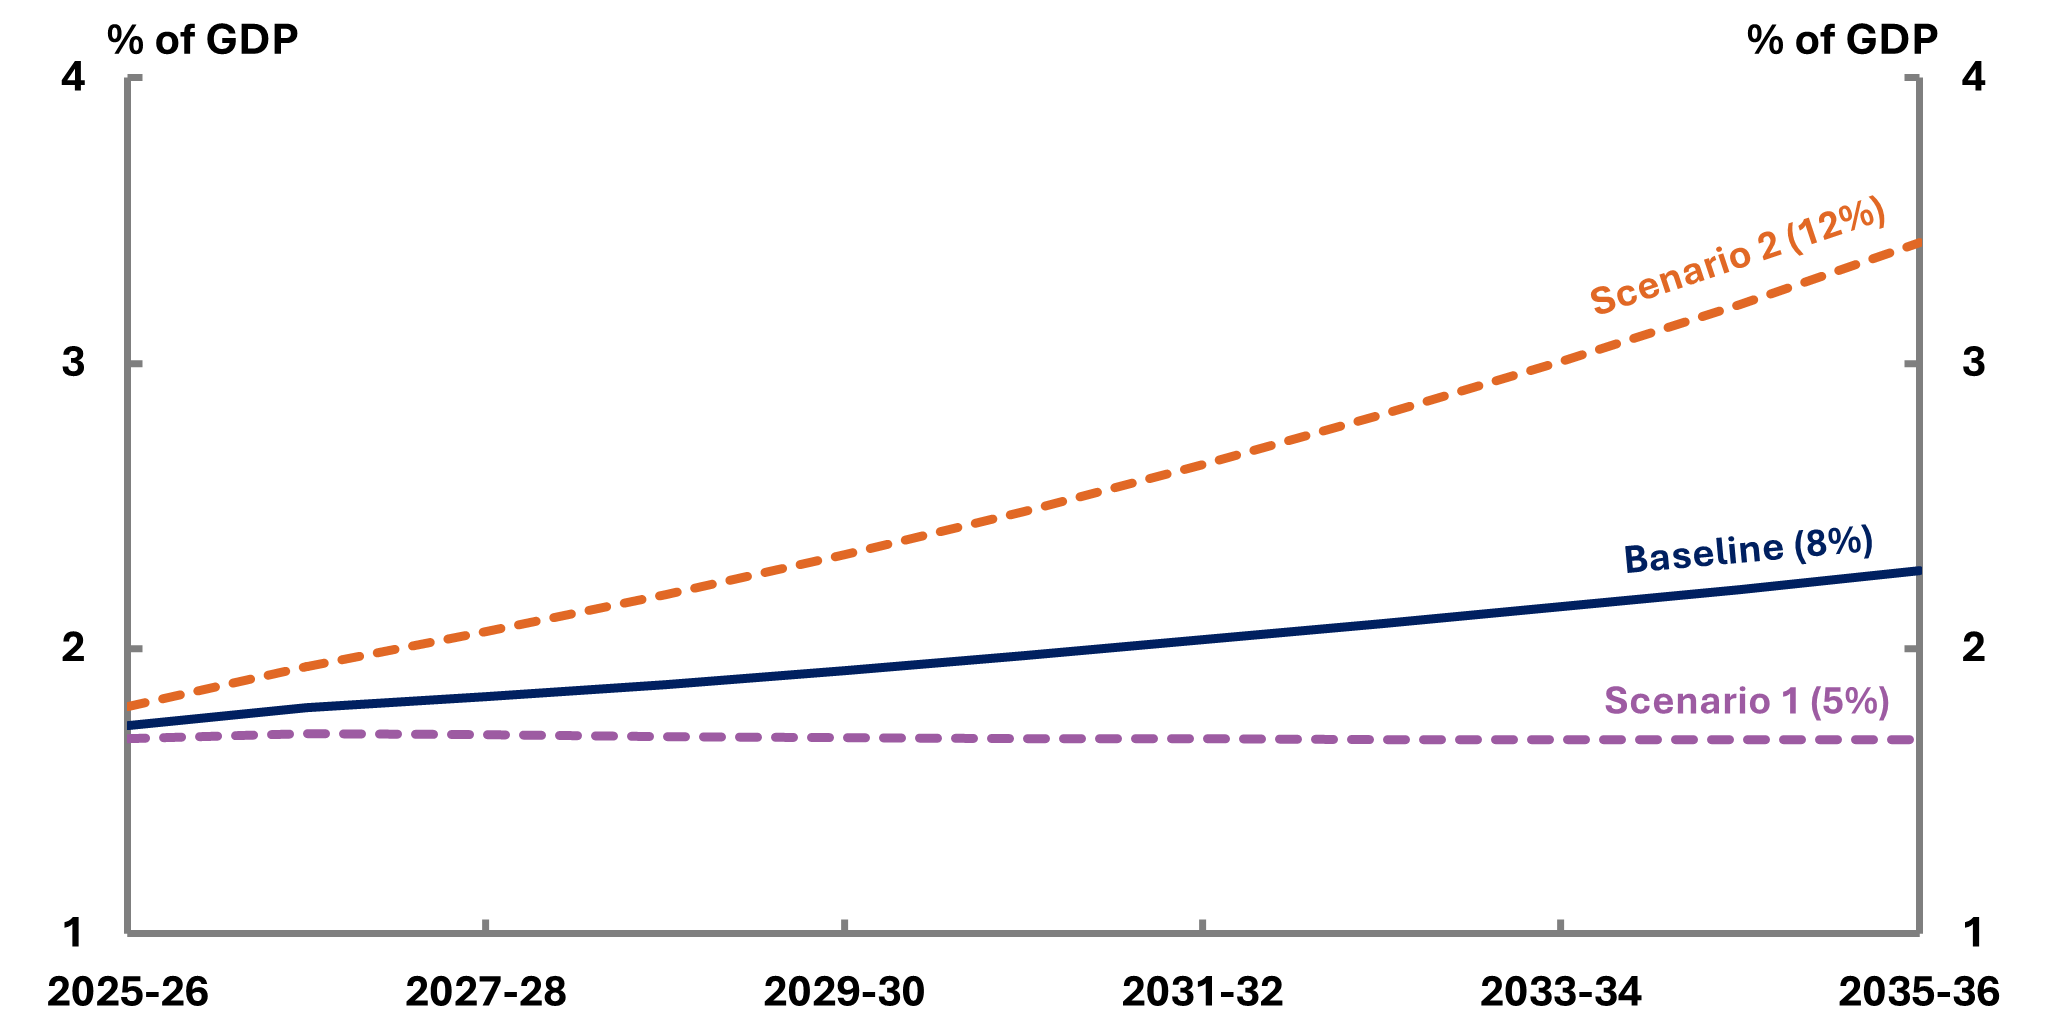
Figure 6-3 provides a comparison of the total NDIS expenditure under the following scenarios:
- Baseline (8%): Growth in total NDIS expenditure from 2028-29 onwards is 8.0% per annum, consistent with the NDIS Financial Sustainability Framework, reaching 2.3% of GDP in 2035‑36.
- Scenario 1 (5%):[22] Growth in total NDIS expenditure moderates further to 5.0% per annum by 2028-29 and remains at this level across the medium term. This results in annual savings of $27 billion and leads to a budget surplus in 2035-36, by which time the scheme would account for 1.7% of GDP.
- Scenario 2 (12%): Growth in total NDIS expenditure reaches 12.0% per annum by 2028-29 and remains at this level across the medium term. This results in extra spending of $53 billion in 2035-36, by which time the schemes expenditure would account for 3.4% of GDP.
Figure 6-3: NDIS growth scenarios: total NDIS, 2025-26 to 2035-36
In response to increasing tension and uncertainty across the global geopolitical environment in recent years, national defence spending[23] has been a topic of interest and discussion:
- At the 2025 North Atlantic Treaty Organization (NATO) Summit in The Hague, NATO members made a commitment to invest in increasing national annual defence spending to at least 3.5% of GDP by 2035. This is part of a larger annual commitment of at least 5.0% of GDP on core defence requirements, defence-related, and security-related spending by 2035.[24]
-
In a US-Australia bilateral meeting alongside the 2025 Shangri-La Dialogue in Singapore, U.S. Secretary of Defence Pete Hegseth met with Australia’s Deputy Prime Minister and Minister for Defence Richard Marles and ‘conveyed that Australia should increase its [defence] spending to 3.5% of its GDP as soon as possible’.[25]
Analysis of rising defence expenditure both in Australia and globally is available from the Parliamentary Library.[26]
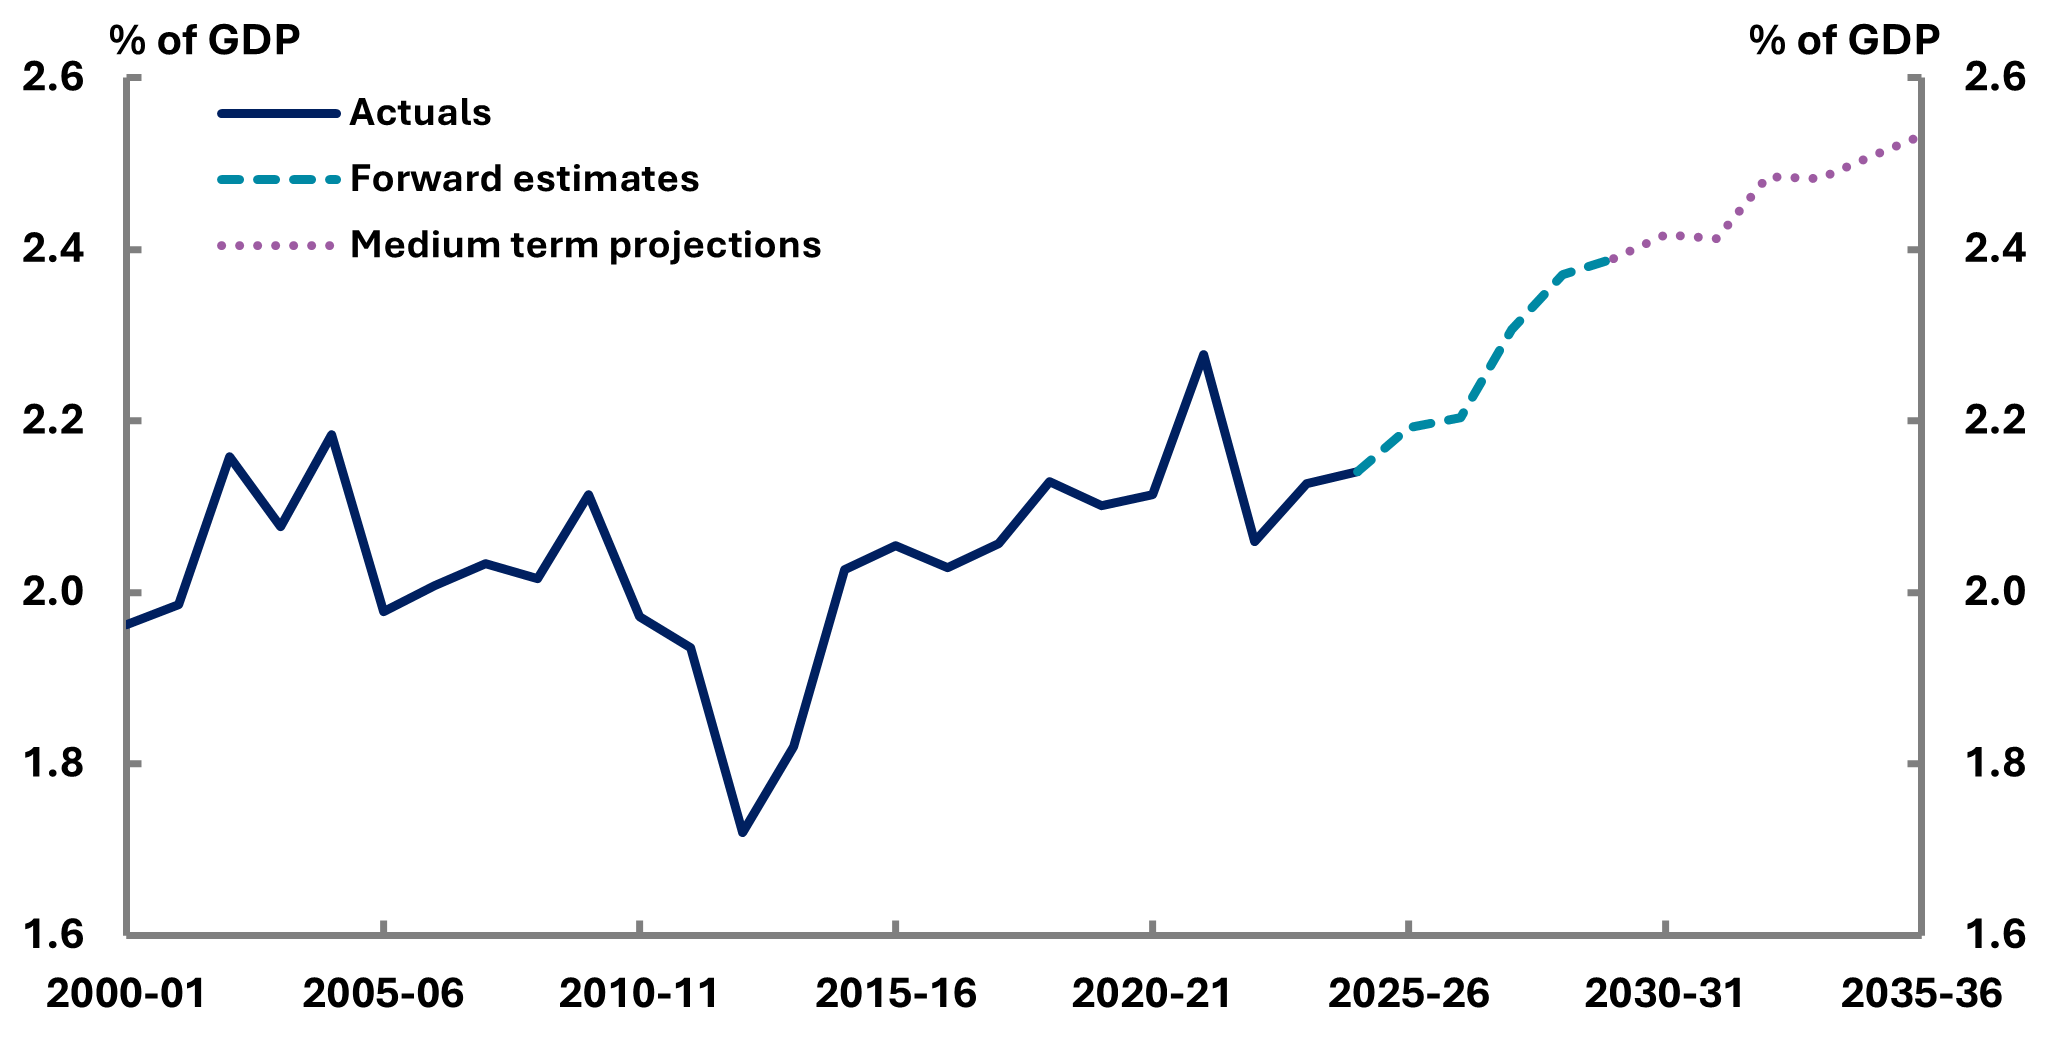
Figure 6-4 shows historical Australian defence spending (as a percentage of GDP) this century, spending over the forward estimates as per the 2025-26 Budget, and over the remainder of the medium term as per the 2024 National Defence Strategy.[27]
Figure 6-4: Defence spending projections, 2000-01 to 2035-36
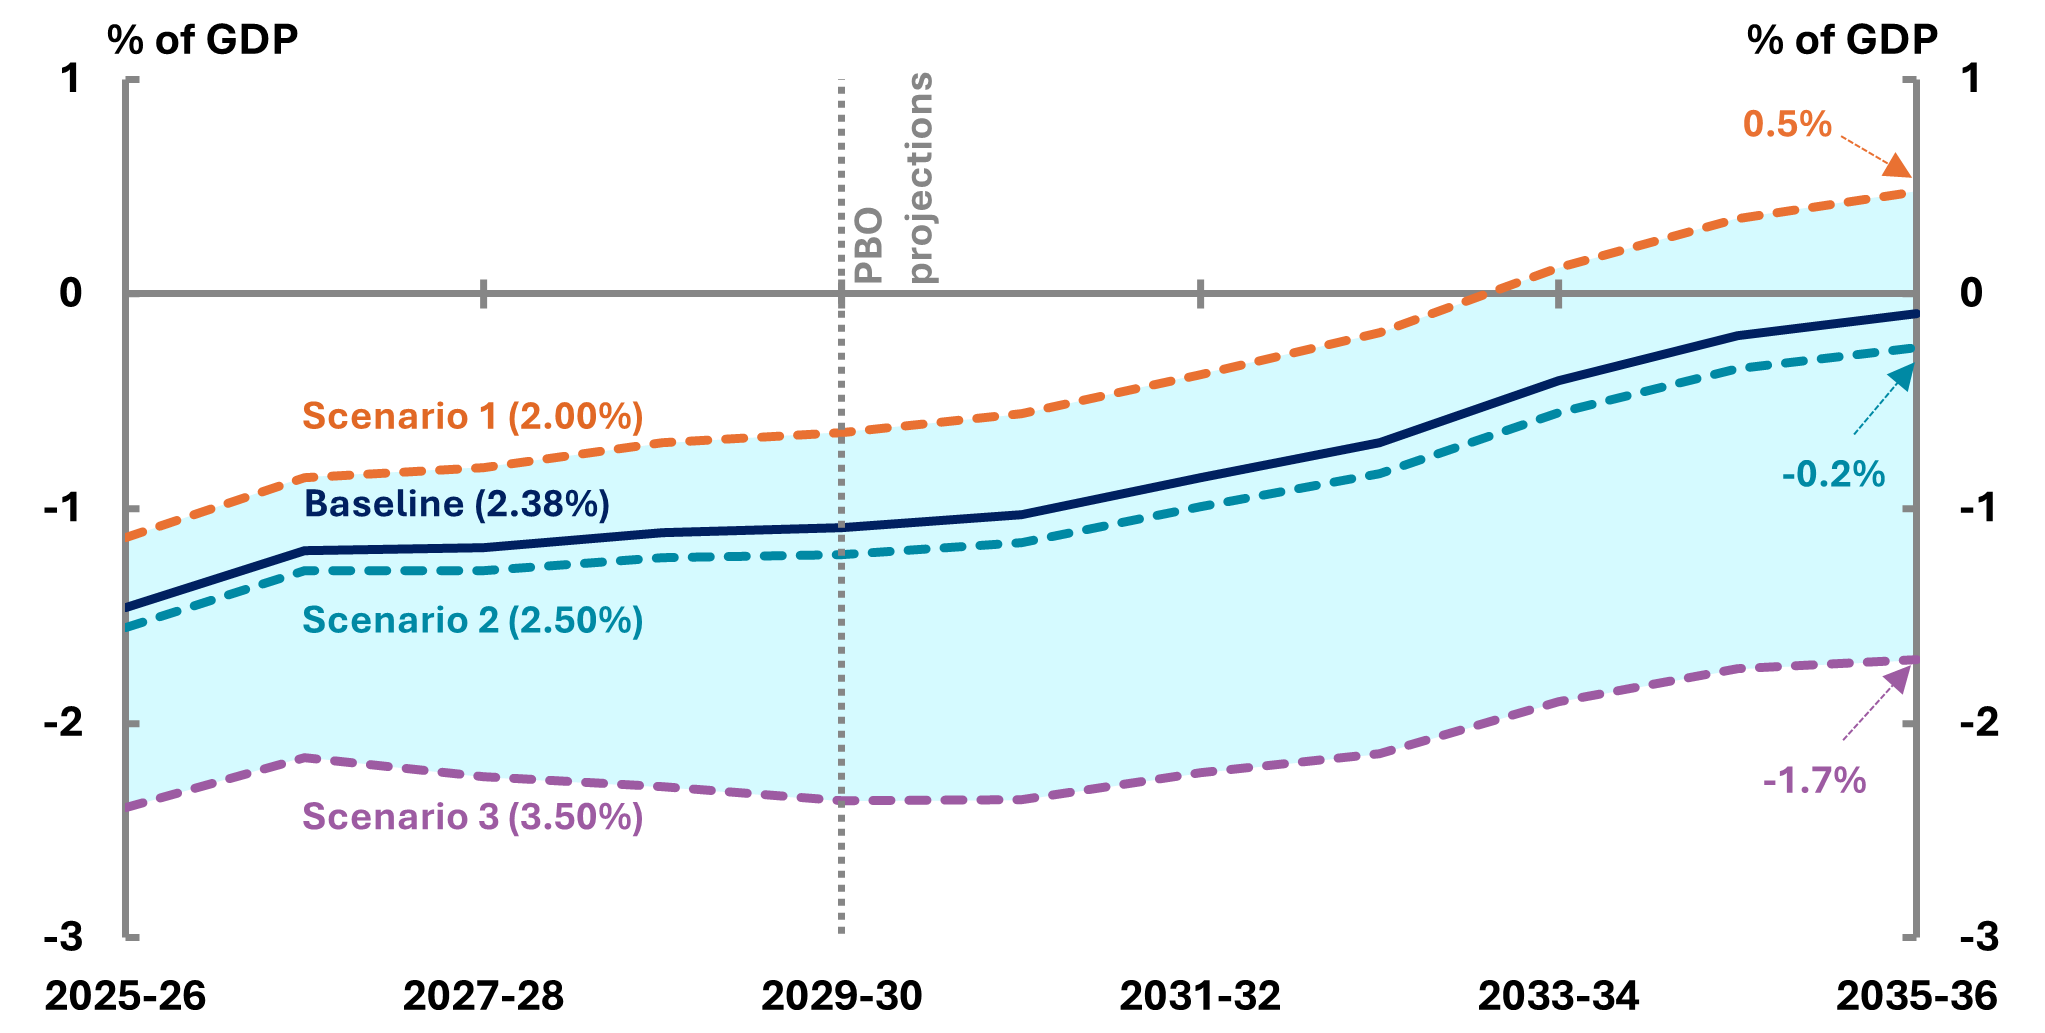
To illustrate the impact of possible trajectories for defence spending, Figure 6-5 presents 3 scenarios for the defence expenditure impacts on the UCB across the period 2024‑25 to 2035‑36.
- Baseline (2.38% of GDP): The baseline of defence spending default as an average of 2.38% of GDP over the medium term, based on the 2025-26 defence spending projections as illustrated in figure 6-4.
- Scenario 1 (2% of GDP): Defence spending targeted at 2% of GDP (a decrease of 0.38% of GDP), resulting in a projected 0.5% improvement of the UCB baseline by 2035-36 (equivalent to an increase of approximately $27 billion).
- Scenario 2 (2.5% of GDP): Defence spending targeted at 2.5% of GDP (a rise of 0.12% of GDP), resulting in a projected 0.2% deterioration of the UCB baseline by 2035-36 (equivalent to a reduction of approximately $8 billion).
- Scenario 3 (3.5% of GDP): Defence spending targeted at 3.5% of GDP (a rise of 1.12% of GDP in 2025-26), resulting in a projected 1.7% deterioration of the UCB baseline by 2035-36 (equivalent to a reduction of approximately $76 billion).
Figure 6-5: Defence spending impact of scenarios on UCB, 2025-26 to 2035-36
The main factors moderating projected growth in total expenses are the cost of the public service and commonwealth grants. These are items which are largely driven by government policy rather than external economic factors.
One reason why this group of expenses is forecast to grow relatively slowly is that many existing policies expire at particular dates in the future.
Ongoing programs, such as the Age Pension will continue as specified indefinitely unless explicitly terminated. Forecast accuracy for these programs largely depends on the accuracy of the economic forecasts underpinning the budget.
In contrast, some programs are not funded beyond a specific date or amount and will naturally expire. The budget includes allowances only for announced policy. Subsequent measures with additional funding are frequently introduced in these areas, such that the budget forecasts will understate the future outcomes. A key example of this is road and rail infrastructure grants to state and territory governments, for which the budget includes an allowance only for announced projects. The forecasts and projections rapidly fall away over the next decade as the projects are assumed to be completed.
Similarly, estimates for the cost of the public service also tend to grow slowly because of the programs not funded beyond a specified period. In addition, successive governments’ have maintained a policy of applying an ‘efficiency dividend’ to public service output, and wage cost assumptions also tend to grow slowly.[28] Historically, these costs are almost always underestimated, with outcomes higher than the earlier estimates. Upward revisions often occur due to factors such as new or extended government programs, responding to unforeseen events and unanticipated increases in prices.
Figure 6-6 shows the evolution of budget forecasts for grant expenses and public service expenses, which are invariably revised upwards over time. The ‘no-policy-change’ basis of budgeting reflects the fact that governments make a mix of temporary and ongoing spending decisions. Making all programs ongoing would be inappropriate in some cases and would also restrict the flexibility of future governments and likely create larger fiscal pressures. Nevertheless, because the budget makes no allowance for future spending decisions, the budget expense forecasts will be too low. Since the medium-term projections are built from the final year of the forward estimates as a base from which to grow these projections will be underestimated to the same degree.
Figure 6-6: Grant and public service expenses, 2008-09 to 2028-29
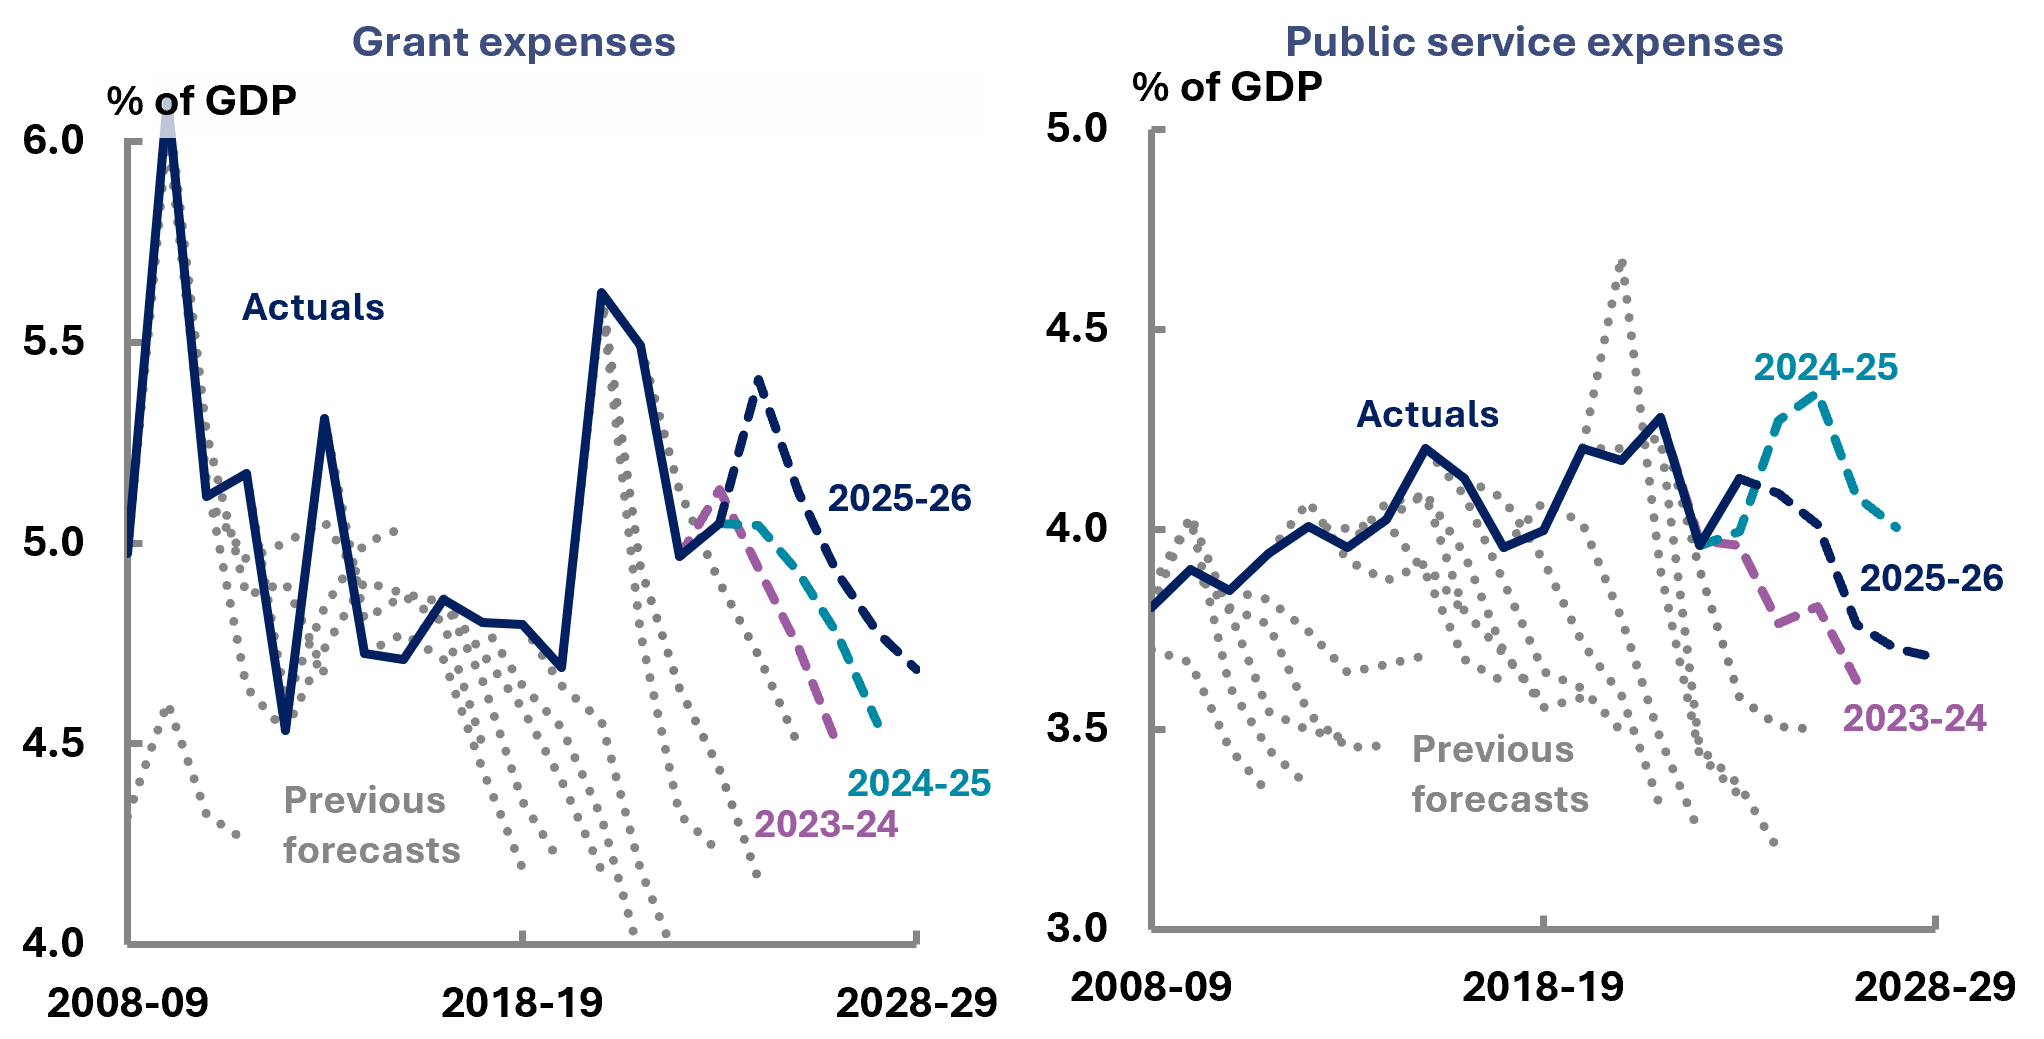
Source: Historical budgets, 2023-24 Budget, 2024-25 Budget, 2025-26 Budget and PBO analysis.
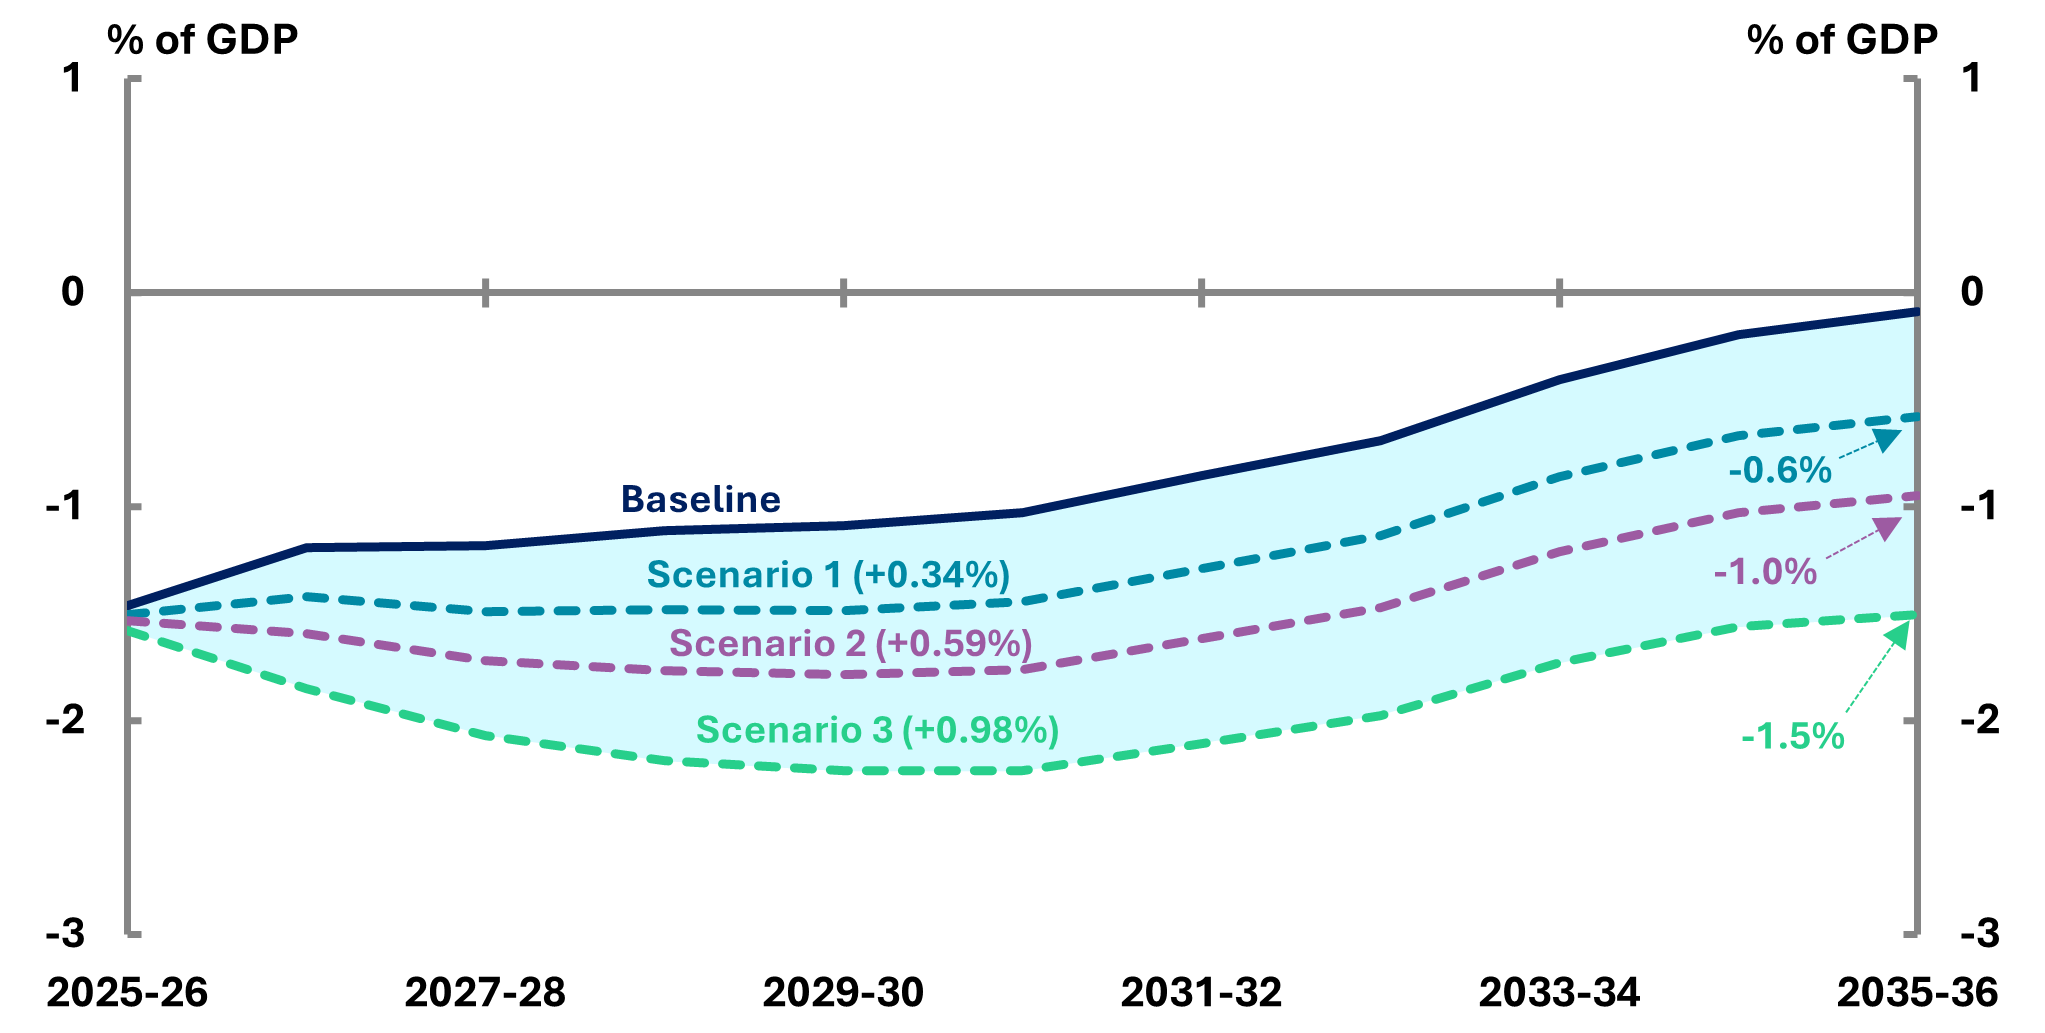
To illustrate the impact of possible higher trajectories for public service expenses, Figure 6-7 below shows the 3 scenarios on the UCB impact of increasing public services expenses across the period 2025-26 to 2035-36:
- Baseline: Under the baseline, public service expenses are projected in line with the 2025-26 UCB forecasts.
- Scenario 1 (+0.34% of GDP): Public service expenses increase by 0.34% GDP per annum (reflecting the average minimum difference between forecasts and actuals over the past decade) by 2028-29 and remain at this level across the medium term. By 2035-36, cumulative spending is $23 billion higher than the baseline.
- Scenario 2 (+0.59% of GDP): Public service expenses rise by 0.59% of GDP per annum (reflecting the average midpoint difference between forecasts and actuals over the past decade) to 2028-29 and remain the same across the medium term. By 2035-36, cumulative spending is $40 billion higher than the baseline.
- Scenario 3 (+0.98% of GDP): Public service expenses increase by 0.98% of GDP per annum (reflecting the average maximum difference between forecasts and actuals over the past decade) to 2028-29 and this increase is maintained across the medium term. By 2035-36, cumulative spending is $66 billion higher than the baseline.
Figure 6-7: Public service expenses impact of the scenarios on the UCB, 2025-26 to 2035-36
Several other government payments are also affected by the ‘no-policy change’ assumption. One of the largest of these is the horizontal fiscal equalisation (HFE) transition payments, which were implemented for the transition to the updated GST distribution system beginning from 2021-22. The new system will ensure that no state will have a per capita GST share lower than the fiscally stronger of New South Wales or Victoria, and no state will receive a share of GST less than 75% of the amount it would receive on a simple per capita calculation.[29]
In order to ensure that no state would be worse off (NoWO) during the transition, additional payments are made to the states. These HFE transition payments were not expected to be needed after 2026-27. More recent budgets have increased the expected size of the transition payments and the government has extended the transition payments period.
The 2025-26 Budget assumes that the transition payments will remain at around $5.6 billion until 2029-30, when the current NoWO guarantee ends. The chance of a further extension to the payments represents an additional risk to the budget.
7 Looking back to the first edition of Beyond the budget
- This chapter presents the comparison between the first Beyond the budget report in 2015-16 (then called Medium-term fiscal projections) and this 10th edition, including fiscal aggregates, receipts and payments components.
- Receipts have fluctuated due to policy changes to personal income tax and unexpected shocks to company tax receipts. Shocks such as Russia’s invasion of Ukraine in 2022 disrupted commodity markets which increased prices of Australian commodity exports.
- Payments have grown larger than expected due to higher-than-predicted growth in the NDIS and policy decisions taken since 2015-16, particularly related to the COVID-19 pandemic.
The 2025-26 edition of Beyond the budget marks 10 years since the PBO’s first publication of medium-term fiscal projections. The 2015‑16 edition presented projections out to 2025-26, now the current year. This chapter shows how those projections from a decade ago compare to what transpired.[30]
Figure 7-1 (left graph) shows the UCB comparison between the first edition in 2015‑16 and the current 2025‑26 edition. In the 2015-16 edition, the government expected to return to surplus by 2020 and the PBO projected that the UCB would reach around 0.4% of GDP[31] by the end of the medium term (2025‑26).
In reality, the actual UCB tracked closely to the government forecasts prior to 2020. The COVID‑19 pandemic then had a devastating impact on the fiscal position, with the UCB reaching a deficit of 6.4% of GDP. This was mainly driven by reductions in tax revenue and budget measures in response to COVID-19. The combined impact of lower-than-projected receipts and higher-than-projected payments during COVID-19 led to a lower-than-expected UCB. For further information on the receipts and payments components affecting the UCB, refer to section 7.2 and 7.3 of this report.
In 2022-23 and 2023‑24 the UCB position returned to similar levels as was originally projected back in 2015‑16. However, from 2024‑25 the fiscal position has worsened. The 2025 26 Budget now estimates the UCB would reach a deficit of around 1.5% of GDP in 2025‑26.
While the UCB has periods where it was close to the 2015‑16 projections, net debt has been consistently higher. The 2015‑16 edition (Figure 7‑1, right graph) projected that net debt would decline steadily to below 10% of GDP over the decade. However, the actual net debt rose beyond 2015‑16 expectations during the pandemic, reaching the peak of around 28% of GDP in 2020‑21. It has since improved, and the 2025‑26 edition shows the net debt projection to stabilise around 22% in 2025‑26.
Figure 7-1: Underlying cash balance and net debt actuals, 2015-16 and 2025-26 publications
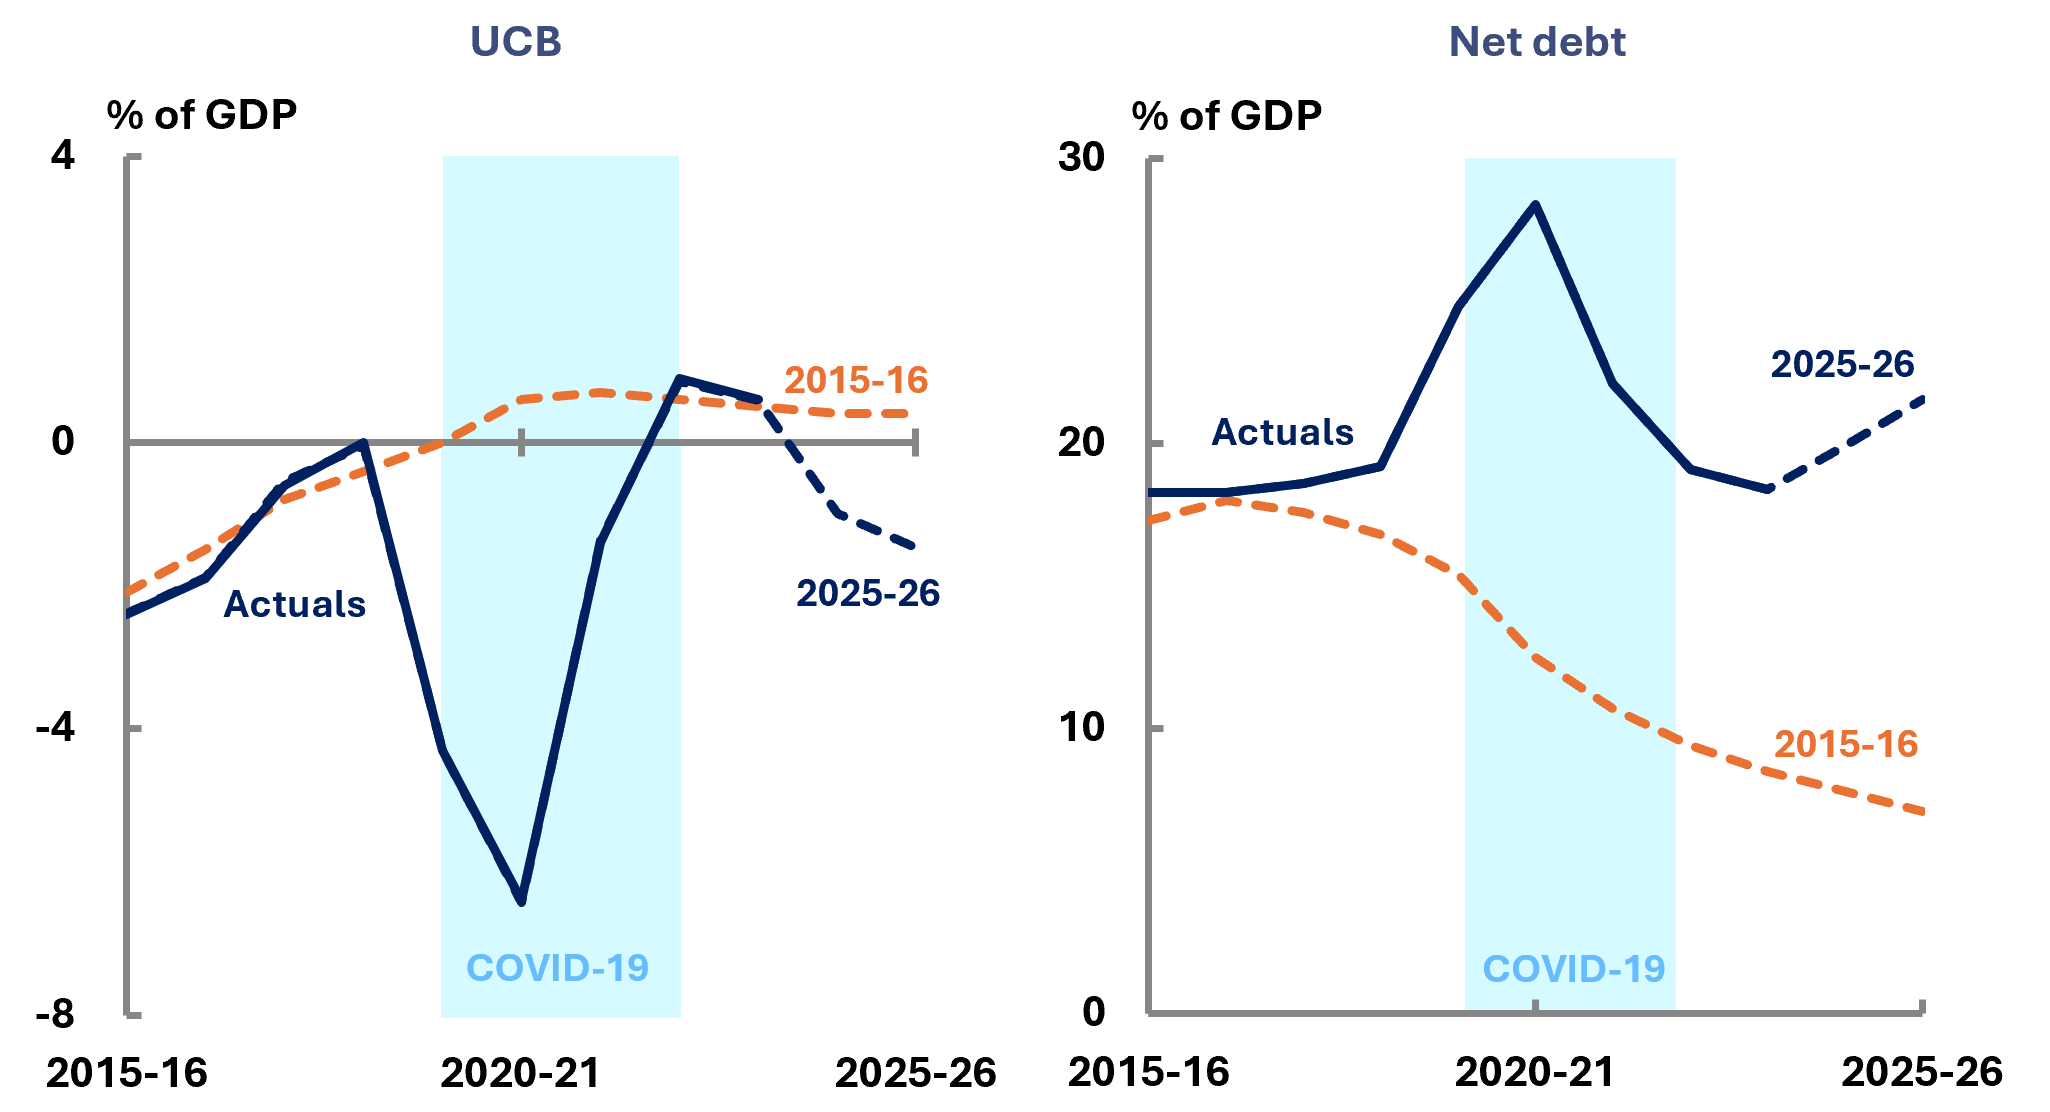
Source: 2023-24 Final Budget Outcome, 2015-16 Budget, 2025-26 Budget and PBO analysis.
Total receipts (tax and non-tax) now expected for 2024-25 and 2025-26 compares very closely to that projected a decade ago (Figure 7-2), although the path along the way was significantly different. Compared to the 2015-16 projections, there have been 2 major factors affecting receipts, which have largely offset each other a decade later.
The first factor is the evolution of the economy. Receipts are highly sensitive to economic fortunes and much more so than government expenses. Our 2015-16 projections were based on average yearly nominal GDP growth of around 5.6% over the decade. The pandemic resulted in a much weaker economy than assumed, but the economy also recovered strongly.
Notably, for the 2015-16 projections the unemployment rate was assumed to settle at 5%, compared to an average of under 4% since 2022. Also, the 2015-16 projections assumed that inflation would settle at 2.5%, significantly lower than the rate over the past few years.
The overall net impact of all the economic fluctuations over the decade is that nominal GDP for 2025‑26 is expected to be within 0.1% of that assumed for our 2015-16 projections.[32]
Figure 7-2: Total receipts, personal income tax and company tax, 2015-16 and 2025-26 publications
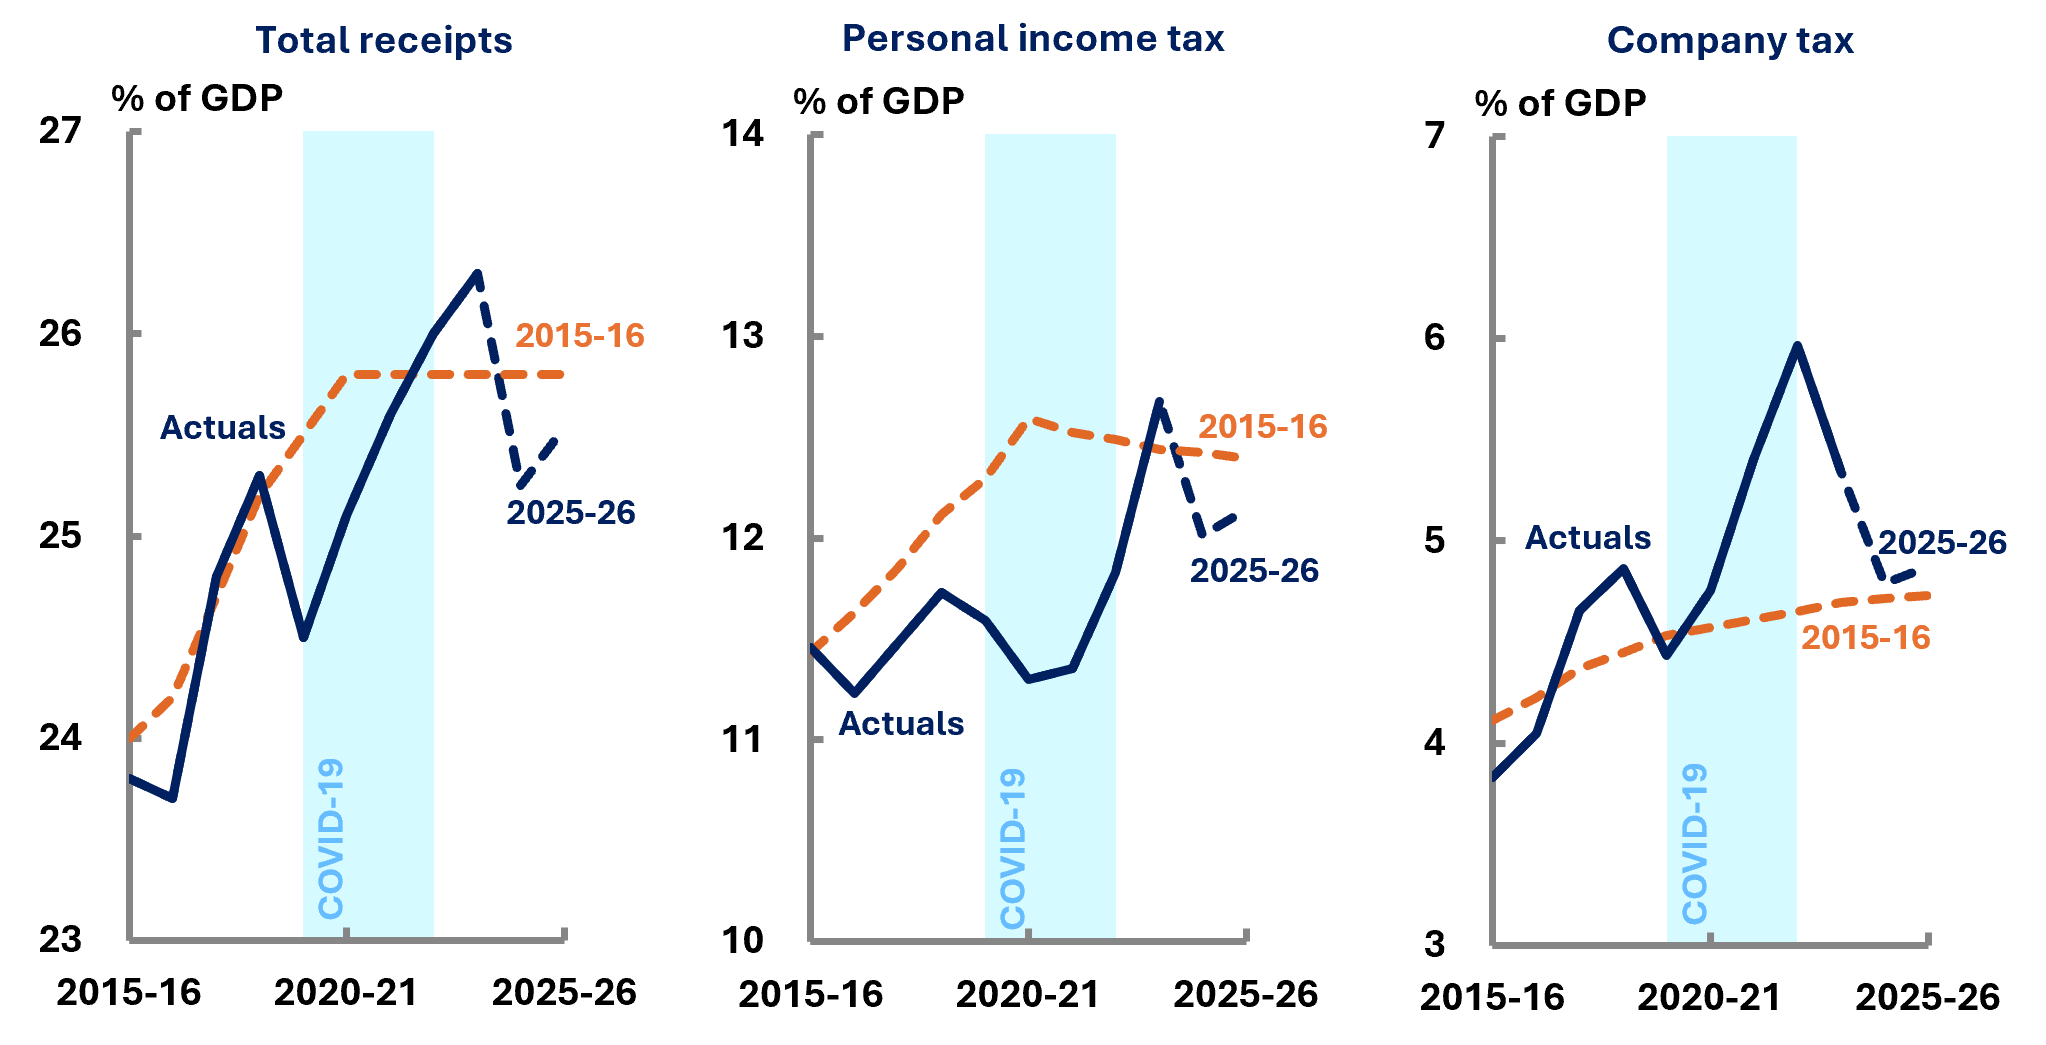
Source: 2023-24 Final Budget Outcome, 2015-16 Budget, 2025-26 Budget and PBO analysis.
Table 7-1: Comparison of 2025-26 receipts estimates, 2015-16 to 2025-26 publication
|
% of GDP |
$ billion |
|||||
|---|---|---|---|---|---|---|
|
2015-16 |
2025-26 |
Change |
2015-16 |
2025-26 |
Change |
|
| Personal income tax |
12.3 |
12.1 |
-0.1 |
352.1 |
349.7 |
-2.4 |
| Company tax |
4.7 |
4.9 |
0.2 |
134.3 |
140.4 |
6.1 |
| Goods and services tax |
3.4 |
3.3 |
-0.2 |
98.9 |
94.2 |
-4.7 |
| Total excise and customs duty |
1.9 |
1.5 |
-0.4 |
55.2 |
43.8 |
-11.4 |
| Other taxes and charges |
1.4 |
1.7 |
0.3 |
38.9 |
48.0 |
9.1 |
| Non-tax receipts |
1.9 |
2.1 |
0.2 |
53.4 |
59.3 |
5.9 |
| Total receipts |
25.5 |
25.5 |
0.0 |
732.8 |
735.4 |
2.6 |
Source: 2015-16 and 2025-26 Budget, and PBO analysis. Numbers may not sum due to rounding.
The second major factor affecting government receipts is the evolution of policy, particularly for personal income tax. Our 2015-16 projections adopted a technical assumption consistent with budgets around that time, that future governments would act to ensure that tax would not increase above 23.9% of GDP. The budget did not specify the precise policy that would implement the ‘cap’. The assumption meant that the PBO’s 2015-16 total receipt projections were flat from 2020-21 as they reached the 23.9% tax-to-GDP limit (Figure 7-2).
In reality, personal income tax cuts were provided in several years: the ‘stage 1’ cuts for 2018-19; the ‘stage 2’ cuts for 2020-21; and the ‘cost of living’ cuts (modified from the previously announced ‘stage 3’ cuts) for 2024-25.
These tax cuts meant that personal income tax evolved significantly differently from that projected by both the PBO and the then government in the 2015-16 budget. Personal income tax is expected to increase to around 12.4% of GDP for 2025-26, almost exactly in line with the level projected a decade ago. While the tax-to-GDP ‘cap’ assumption did not match the exact timing of the tax cuts, in this case it proved to be a reasonable basis on which to project receipts a decade into the future. This is perhaps unsurprising: governments have always provided regular tax relief for individuals throughout history, and the ‘cap’ simply assumed that this would continue in the future, which it did.
From the 2022-23 October Budget, the 23.9% tax-to-GDP cap is no longer part of the government’s fiscal strategy.
Company tax receipts have also fluctuated over the decade, largely due to significant volatility in commodity prices, but have returned close to our projection. Along the way there have also been changes to the tax system, such as the creation of the Tax Avoidance Taskforce through the Tax Integrity Package and the Ten Year Enterprise Tax Plan.
Company tax receipts reached a record 6% of GDP in 2022-23 (see Figure 7-2). This was due to record commodity export earnings in 2022-23, a record year for both resource and energy exports ($466 billion)[33] and agricultural exports ($78 billion).[34]Russia’s invasion of Ukraine in 2022 led to increased energy and grain prices and worsened existing supply chain issues. As supply chain issues ease, commodity prices continue to return to long-term averages.
Similar to receipts, the pandemic led to significant deviations from the 2015-16 projections for payments, but the differences are now much smaller.
The COVID-19 pandemic resulted in higher-than-projected actual payments of around 31.4% of GDP in 2020‑21. This was due to policy decisions taken such as, JobKeeper and JobSeeker income support. During 2020-21, the Government committed $136 billion in COVID-19 economic response measures.[35]
While the largest lasting fiscal impact of the pandemic is the additional debt, PDI payments are only a little higher for 2025-26 than projected back in 2015. This is because debt during the pandemic was issued at very low interest rates. However, as this debt matures and is rolled over into new debt at higher interest rates, PDI costs are expected to rise rapidly.
Table 7-2 shows the changes in modelled payments as a percentage of GDP in the 2015-16 report compared to this report. Several items have increased more than projected, particularly the NDIS. This is due to higher-than-expected demand and changes to funding arrangements, such as aged care reforms since the 2015 16 edition.
Other items have not increased as much as projected, for a variety of reasons. A common factor will be that the projections obviously did not include subsequently announced and enacted policy decisions.[36] For example, the Age Pension has grown less than expected partly due to changes to Age Pension eligibility requirements. From 1 July 2017, the Age Pension age has progressively increased which has reduced the number of people eligible for the payment. In addition, there has also been an increase in the proportion of the population on partial Age Pensions and who are self-funded retirees due to a growing shift towards superannuation as a source of retirement income.
Figure 7-3: Total payments and NDIS, 2015-16 and 2025-26 publications
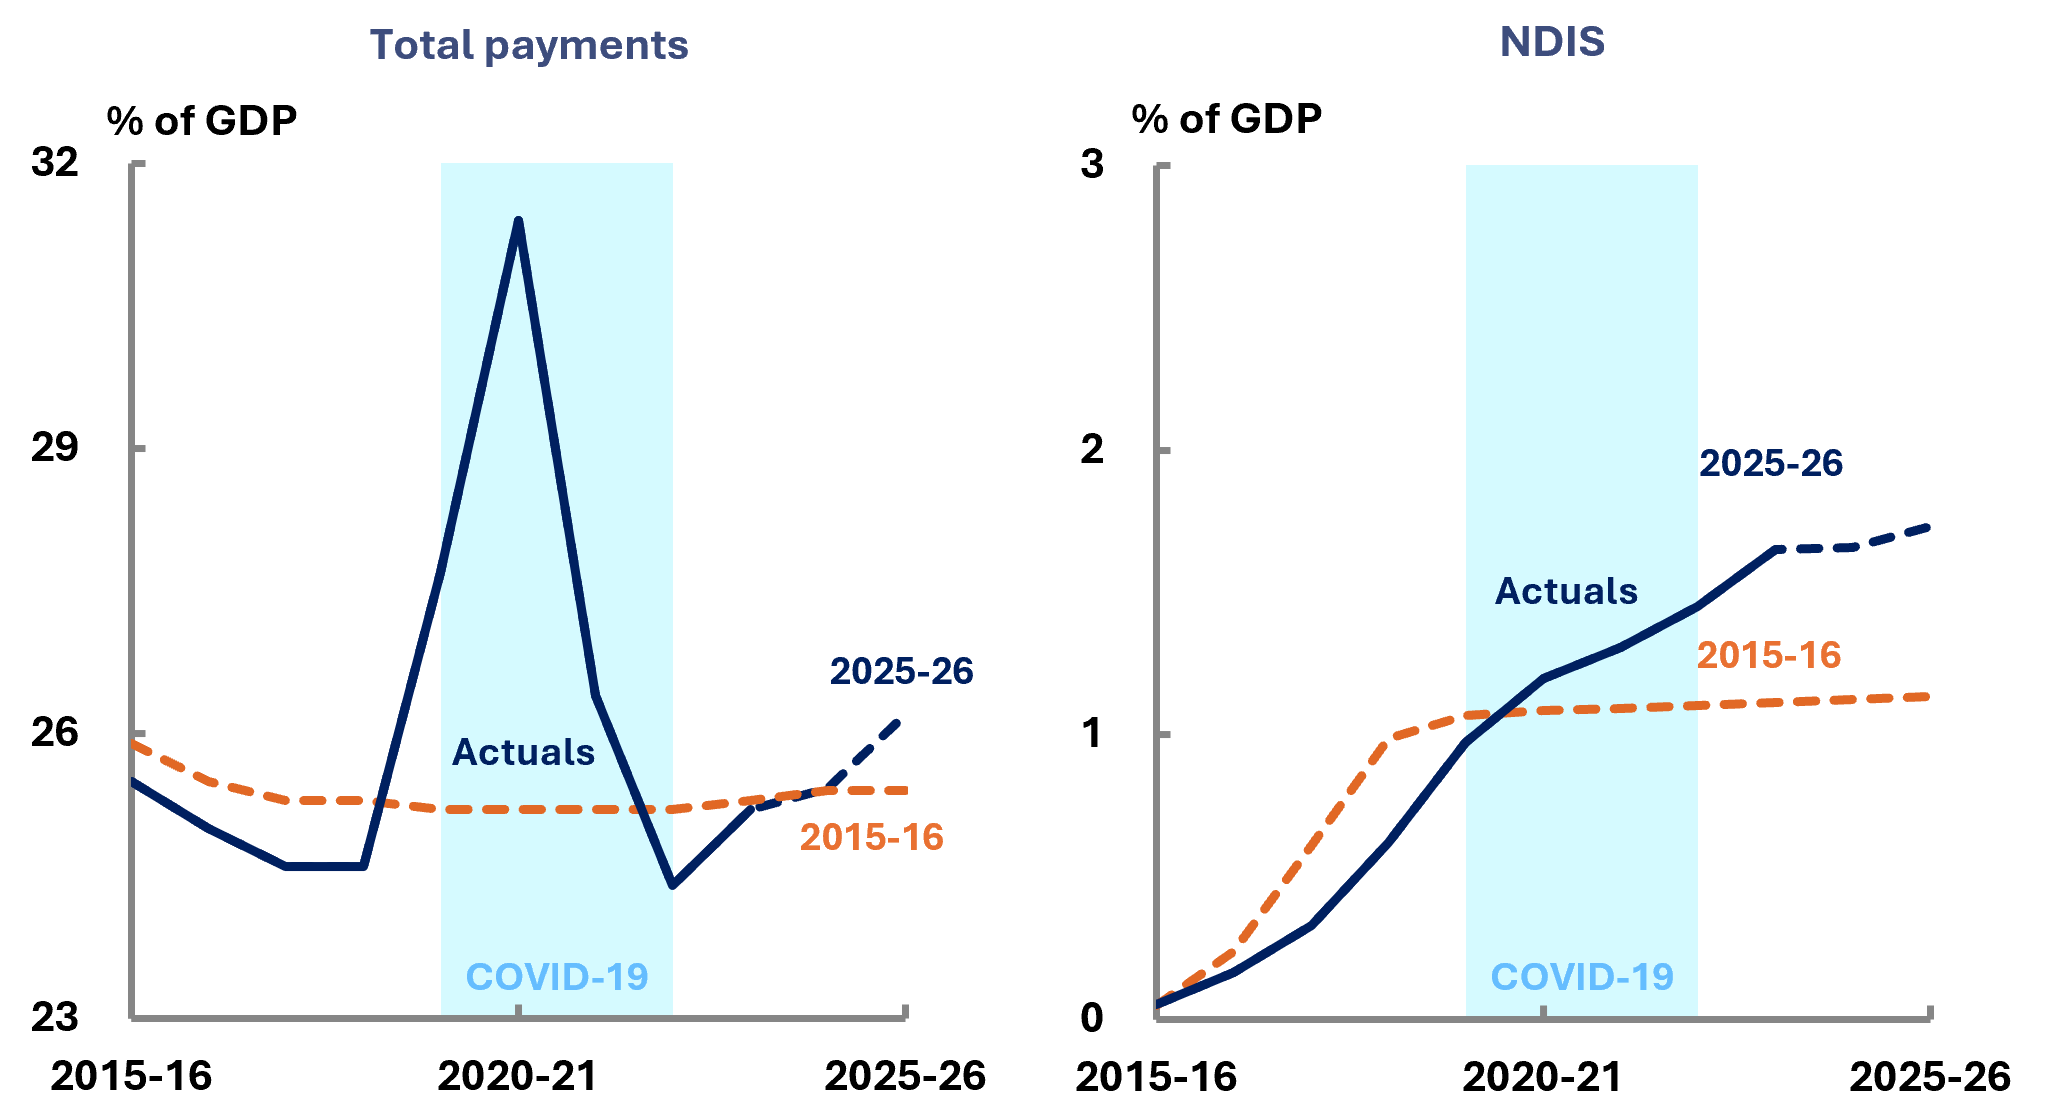
Source: 2023-24 Final Budget Outcome, 2015-16 Budget and 2025-26 Budget and PBO analysis.
Table 7-2: Comparison of 2025-26 payments estimates, change from 2015-16 to 2025-26 publication (top 10 differences)
|
% of GDP |
$ billion |
|||||
|---|---|---|---|---|---|---|
|
2015-16 |
2025-26 |
Change |
2015-16 |
2025-26 |
Change |
|
| NDIS |
1.1 |
1.7 |
0.6 |
32.2 |
49.8 |
17.6 |
| Aged care |
1.1 |
1.4 |
0.3 |
31.7 |
41.1 |
9.4 |
| Public hospitals |
0.9 |
1.2 |
0.3 |
24.9 |
34.0 |
9.1 |
| PBS |
0.6 |
0.7 |
0.2 |
16.1 |
21.5 |
5.4 |
| Interest on debt |
0.8 |
0.9 |
0.1 |
23.7 |
26.5 |
2.8 |
| Childcare |
0.7 |
0.6 |
-0.1 |
20.2 |
16.2 |
-4.0 |
| Schools and higher education |
1.4 |
1.2 |
-0.2 |
39.1 |
34.6 |
-4.5 |
| Carer income support |
0.6 |
0.4 |
-0.2 |
18.4 |
12.3 |
-6.1 |
| Family Tax Benefit |
0.9 |
0.6 |
-0.2 |
24.7 |
17.9 |
-6.8 |
| Age Pension |
2.5 |
2.3 |
-0.2 |
71.9 |
65.0 |
-6.9 |
| Other Payments |
14.6 |
15.8 |
1.2 |
419.7 |
455.8 |
36.1 |
| Total payments |
25.1 |
26.9 |
1.8 |
722.6 |
774.7 |
52.1 |
Note: The 2015-16 edition did not provide as much detail as recent editions of Beyond the budget. This means that the ‘Other payments’ category is larger than that shown for the 2025-26 projections.
Source: 2015-16 Budget and 2025-26 Budget and PBO analysis.
Appendices
This appendix outlines the economic context for our Beyond the budget 2025-26 and the underlying methodology.
The PBO’s projections in this report are based on the policy settings, economic parameters, and budget outcomes of the most recent Australian Government budget. References throughout this report for the period to 2028-29 (the ‘forward estimates’), are based on the 2025-26 Budget, while references to the fiscal projections in the period beyond 2028-29, or the medium term, represent the PBO’s projections. The PBO’s medium-term projections are developed independently but are broadly consistent with the medium-term budget position presented in the 2025-26 Budget. The PBO’s projection for the UCB in 2035-36 is not significantly different to that presented in the budget.
Projections for revenue are generally prepared using a ‘base-plus-growth’ methodology. Economic parameters are used to estimate growth rates, which are then applied to the relevant base. Projections for expenses are prepared by multiplying the number of expected recipients by the average expense and consider a range of factors. These include population growth, the age structure of the population, estimates of trends in the demand for government services, and program indexation arrangements.
Major fiscal aggregates are presented on both an accrual and cash basis and prepared through a balance sheet framework that uses accounting identities, consistent with our previous reports. Detailed revenue and expense projections are on an accrual basis.
For further information on our balance sheet framework, see our Beyond the budget 2021-22 report.
Forecasts and projections of economic parameters underpin our analysis. The key economic parameter forecasts are summarised in Budget Paper No. 1 of the 2025-26 Budget (Table 1.1).
Table 1.1: Major economic parameters(a)
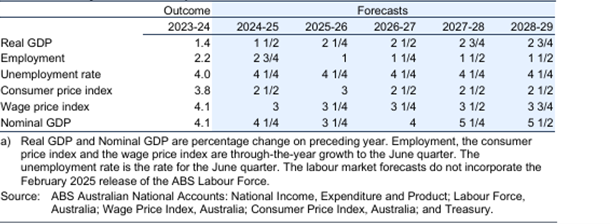
Source: As presented in Budget Paper No.1, 2025-26 Budget, page 6. While the budget does not include a comparison of these economic parameters with those from the previous fiscal update, our 2025-26 Budget Snapshot, released on budget night, presents the changes.
The key changes in the economic outlook presented in the 2025-26 Budget compared to the 2024‑25 Budget (the starting point for our Beyond the budget 2025-26 report) are:
-
Economic growth (nominal GDP) is forecast to be slightly lower in 2025-26 but then higher from 2026-27 onward (shown in Figure A-1 below).
-
Employment growth is forecast to be lower in 2025-26, but then broadly consistent in 2026 27.
-
Inflation, measured by the CPI, is forecast to be slightly higher in 2025-26, before becoming broadly consistent levels from 2026-27 onward.
Figure A-1: Nominal GDP growth, 1998-99 to 2028-29
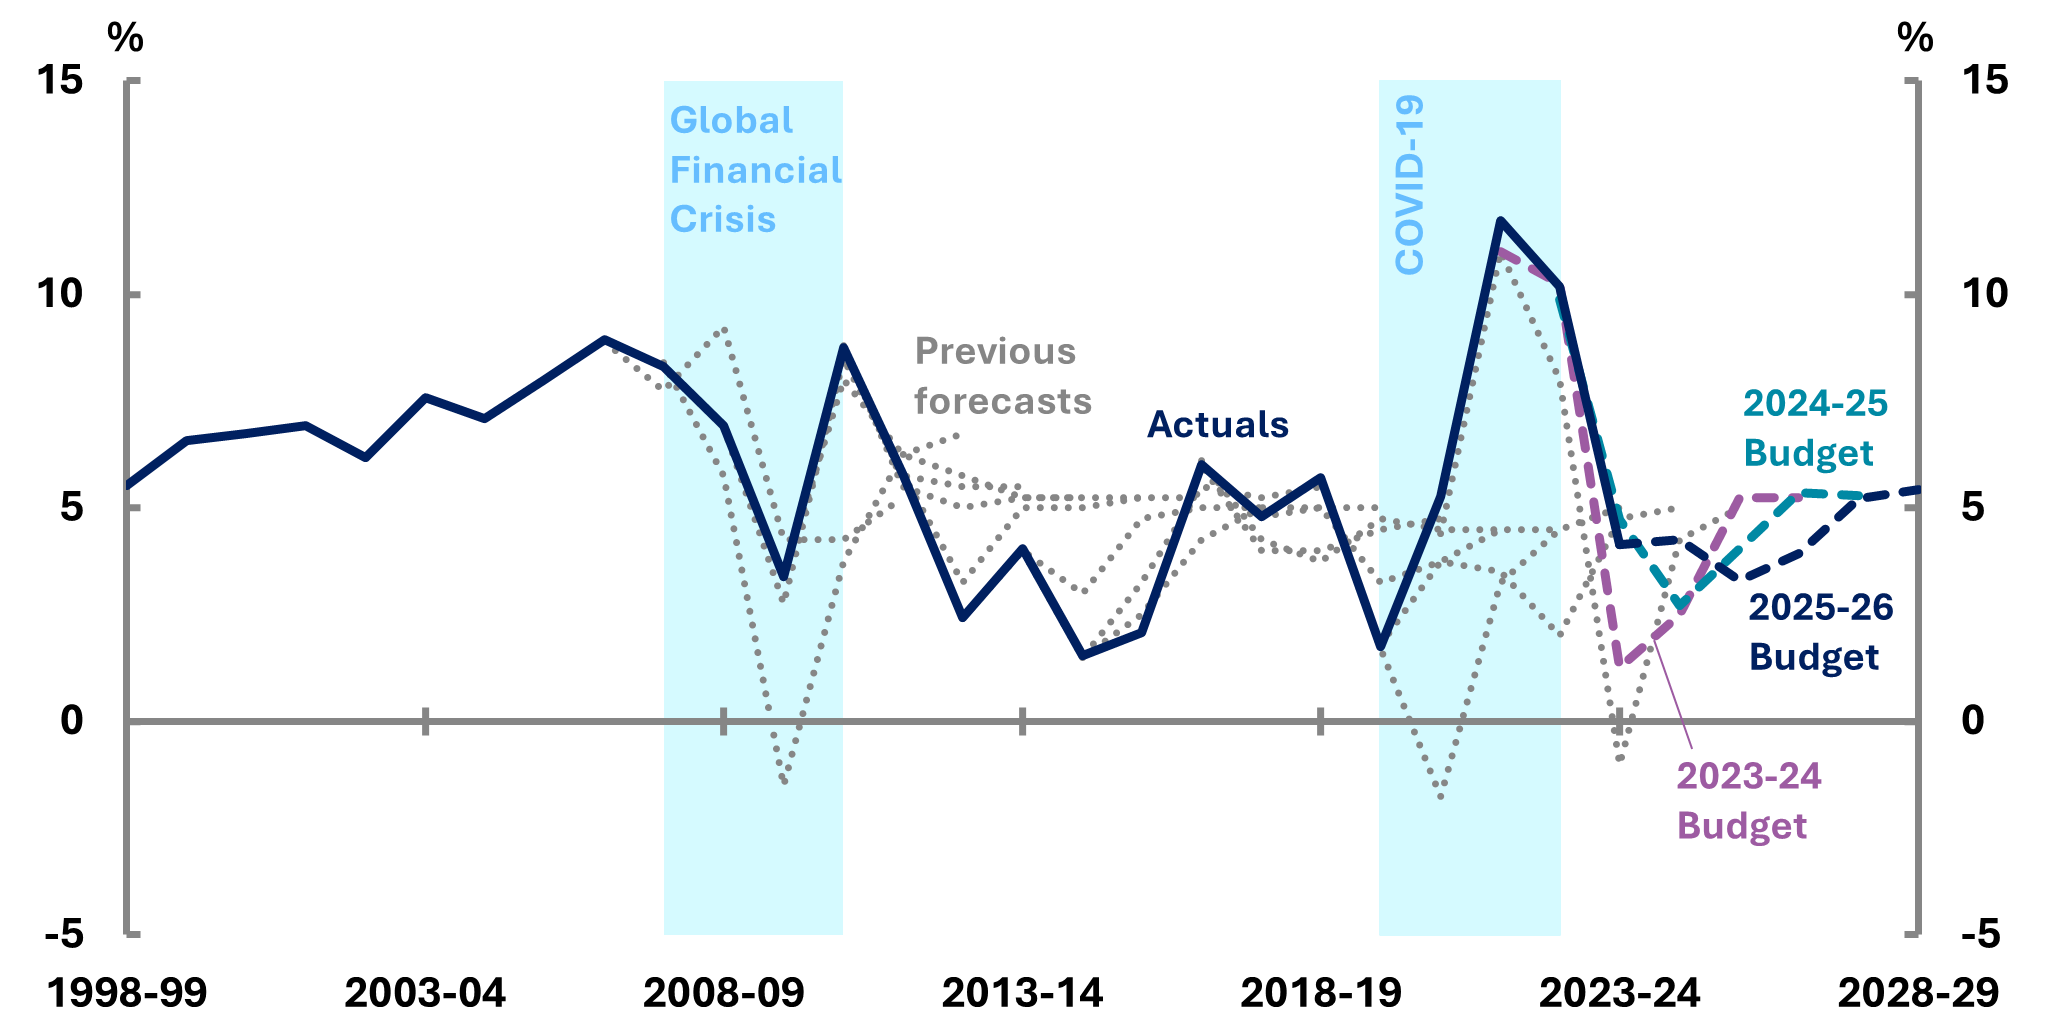
Source: Historical budgets, 2023-24 Budget, 2024-25 Budget, 2025-26 Budget, and PBO analysis.
Estimates of fiscal aggregates in the forward estimates period provide the starting point for our fiscal projections across the medium- and long-term periods. Estimates of key fiscal aggregates across the forward estimates are also summarised in Budget Paper No. 1 of the 2025-26 Budget (Table 1.2).
Table 1.2: Budget aggregates
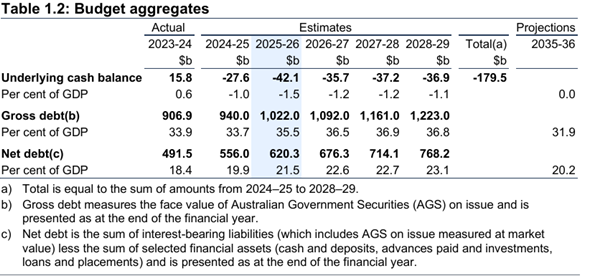
Source: As presented in Budget Paper No.1, 2025-26 Budget, page 7.
Changes in the budget aggregates between budgets reflect the impact of the prior year actuals as a starting point, parameter variations and policy decisions.
Based on the estimates in the 2025-26 Budget, 2024-25 is expected to be broadly consistent with the forecast in the 2024-25 Budget.
In general, economic parameter variations contributed the most to the change between budgets, remaining larger than new policy decisions across the period (see Figure A-2).
Figure A-2: Change in underlying cash balance since the 2024-25 MYEFO
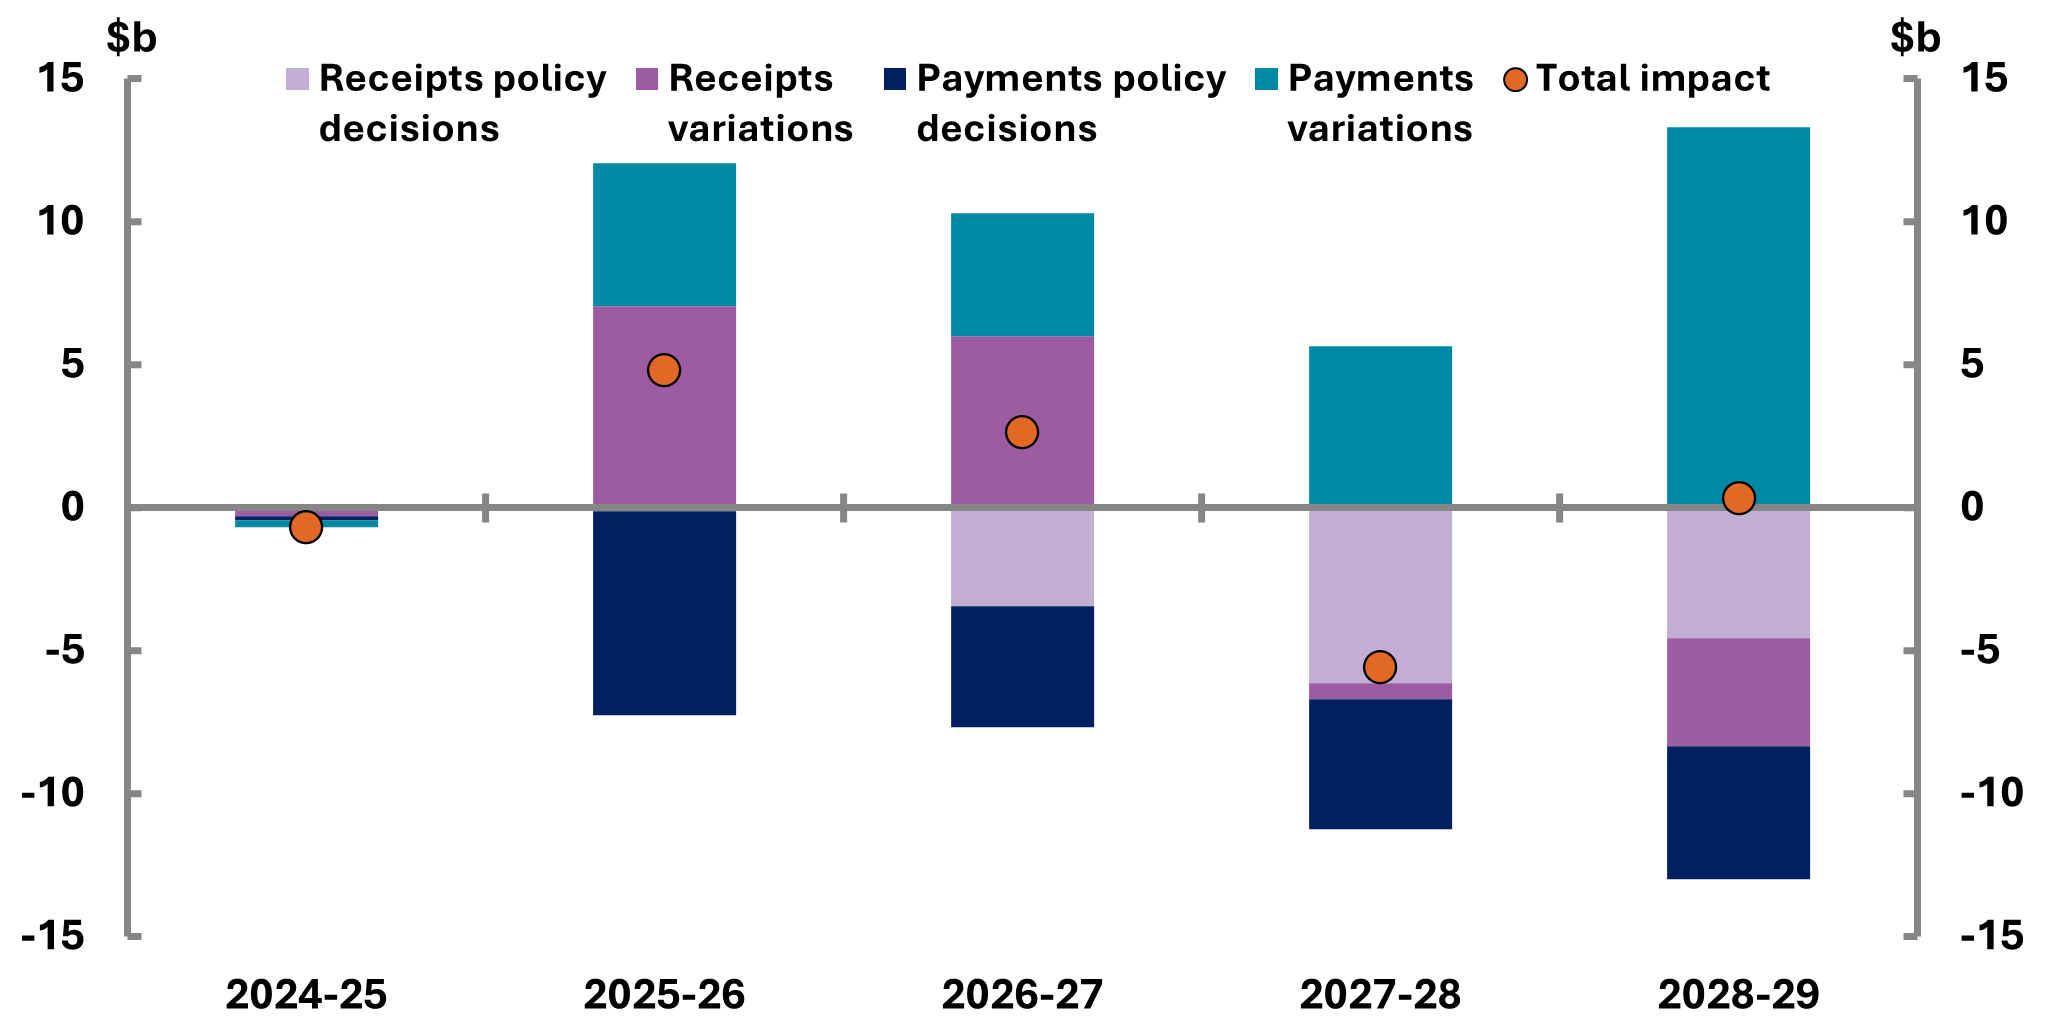
The key risks to the economic outlook, as articulated in the 2025-26 Budget, are on the downside, with uncertainty around global economic conditions flowing through to Australia. Key risks relate to the impacts of geopolitical instability, as well as higher than anticipated inflation and interest rates. More detail on the economic outlook and the risks are in Budget Statement 2: Economic Outlook.
Medium-term fiscal strategy
The 2025-26 Budget fiscal strategy was unchanged from the 2024-25 Budget, to ‘improve the budget position in a measured way, consistent with the overarching goal of reducing gross debt as share of the economy over time’. This was underpinned by ‘allowing tax receipts and income support to respond in line with changes in the economy and directing the majority of improvements in tax receipts to budget repair’. It also sought to limit ‘ growth in spending until gross debt as a share of GDP is on a downwards trajectory, while growth prospects are sound and unemployment is low.’[37]
Bridging the balances
The net operating balance (NOB), FB, HCB and PCB are common aggregates used in conjunction with the underlying cash balance to examine the budget position.
- The net operating balance (NOB) is equal to the government’s revenue minus its expenses, excluding expenses related to revaluations (such as the write-down of assets). The NOB is an accrual measure, recognising income when it is earned and expenses when they are incurred, even though the associated cash transactions may occur in different financial years.
- The underlying cash balance (UCB) is the difference between the government’s receipts and its payments. The UCB is a cash measure, which means it records income when it is received and payments when they are made, even though those amounts might have been earned or incurred in a different financial year. Generally, when the government or the media say that the budget is in a deficit or a surplus, they are referring to the UCB.
- The headline cash balance (HCB) is similar to the UCB, but it also accounts for the government’s investment in financial assets for policy purposes (such as student loans and equity injections). Policies affecting the headline cash balance can have an impact on debt even if they do not affect the underlying cash balance.
- The primary cash balance (PCB) adjusts the UCB to exclude net interest payments. As governments have little control over interest payments in the short term (interest payments are largely determined by the size of previous budget deficits), it can be useful to view this as a budget balance that is largely within the government’s control.
For further information, see our Online budget glossary.
Table B-1: Comparison of revenue programs
|
% of GDP |
$ billion |
% of revenue |
|||||
|---|---|---|---|---|---|---|---|
|
|
2025-26 |
2035-36 |
Change |
2025-26 |
2035-36 |
Change |
2035-36 |
| Personal income tax |
12.4 |
14.5 |
2.1 |
357.8 |
681.8 |
324.0 |
53.0 |
| Company tax |
5.0 |
4.7 |
-0.3 |
143.5 |
219.4 |
75.9 |
17.1 |
| Goods and services tax |
3.4 |
3.4 |
0.0 |
99.3 |
159.9 |
60.6 |
12.4 |
| Total excise and customs duty |
1.5 |
1.2 |
-0.3 |
43.8 |
57.1 |
13.3 |
4.4 |
| Superannuation fund taxes |
0.9 |
0.9 |
0.0 |
25.6 |
42.1 |
16.5 |
3.3 |
| Fringe benefits tax |
0.2 |
0.2 |
0.0 |
5.2 |
7.9 |
2.8 |
0.6 |
| Resource rent taxes |
0.1 |
0.0 |
0.0 |
2.0 |
2.3 |
0.4 |
0.2 |
| Luxury car tax |
0.0 |
0.0 |
0.0 |
1.2 |
2.0 |
0.8 |
0.2 |
| Wine equalisation tax |
0.0 |
0.0 |
0.0 |
1.2 |
1.6 |
0.4 |
0.1 |
| Other taxes and charges |
0.5 |
0.5 |
0.0 |
14.8 |
21.8 |
7.0 |
1.7 |
| Non-tax revenue |
1.9 |
1.9 |
0.0 |
56.0 |
89.5 |
33.5 |
7.0 |
| Total revenue |
26.1 |
27.4 |
1.3 |
750.3 |
1,285.5 |
535.2 |
100.0 |
Note: ‘Change’ refers to the total change between 2025-26 and 2035-36. Numbers may not sum due to rounding.
Source: 2025-26 Budget and PBO analysis.
Table B-2: Comparison of expense programs
|
% of GDP |
$ billion |
% of revenue |
|||||
|---|---|---|---|---|---|---|---|
|
|
2025-26 |
2035-36 |
Change |
2025-26 |
2035-36 |
Change |
2035-36 |
| GST transfers to states |
3.5 |
3.3 |
-0.2 |
100.1 |
152.2 |
53.1 |
12.1 |
| National Disability Insurance Scheme |
1.7 |
2.3 |
0.5 |
49.8 |
106.7 |
56.8 |
8.5 |
| Age pension |
2.3 |
2.2 |
0.0 |
65.0 |
105.2 |
56.8 |
8.5 |
| Defence |
1.9 |
2.1 |
0.2 |
55.5 |
98.8 |
43.3 |
7.8 |
| Interest on debt |
1.3 |
1.8 |
0.5 |
38.7 |
86.7 |
48.0 |
6.9 |
| Aged care |
1.4 |
1.5 |
0.1 |
41.1 |
72.3 |
31.3 |
5.7 |
| Public hospitals |
1.2 |
1.3 |
0.1 |
34.0 |
60.4 |
26.4 |
4.8 |
| Medicare Benefits Schedule |
1.2 |
1.3 |
0.1 |
35.2 |
60.1 |
24.9 |
4.8 |
| Public service (non-defence) |
1.9 |
1.2 |
-0.7 |
54.4 |
57.8 |
3.5 |
4.6 |
| Schools and higher education |
1.2 |
1.1 |
-0.1 |
34.6 |
49.8 |
15.2 |
3.9 |
| Disability support pension |
0.8 |
0.8 |
0.0 |
24.2 |
37.9 |
13.8 |
3.0 |
| Pharmaceuticals Benefits Scheme |
0.7 |
0.7 |
-0.1 |
21.5 |
31.7 |
10.2 |
2.5 |
| Childcare subsidies |
0.6 |
0.6 |
0.0 |
16.2 |
27.0 |
10.7 |
2.1 |
| Income support for the unemployed |
0.6 |
0.5 |
-0.1 |
17.0 |
22.8 |
5.8 |
1.8 |
| Family tax benefit |
0.6 |
0.4 |
-0.2 |
17.9 |
20.3 |
2.4 |
1.6 |
| Carer income support |
0.4 |
0.4 |
0.0 |
12.3 |
19.2 |
6.9 |
1.5 |
| Fuel tax credits |
0.4 |
0.4 |
0.0 |
10.8 |
18.3 |
7.5 |
1.5 |
| Commonwealth grant scheme |
0.3 |
0.3 |
0.0 |
8.6 |
12.4 |
3.8 |
1.0 |
| Parenting payment |
0.3 |
0.2 |
0.0 |
8.2 |
11.4 |
3.2 |
0.9 |
| Infrastructure grants |
0.5 |
0.2 |
-0.2 |
13.2 |
10.7 |
-2.5 |
0.9 |
| Private health insurance rebate |
0.3 |
0.2 |
0.0 |
7.8 |
10.7 |
2.9 |
0.9 |
| Health care payments for veterans |
0.2 |
0.2 |
0.0 |
6.8 |
9.1 |
2.3 |
0.7 |
| Parental leave pay |
0.1 |
0.2 |
0.0 |
4.1 |
7.2 |
3.1 |
0.6 |
| Student payments |
0.1 |
0.1 |
0.0 |
3.0 |
4.5 |
1.5 |
0.4 |
| Veterans personal benefits |
0.2 |
0.1 |
-0.1 |
4.3 |
3.5 |
-0.8 |
0.3 |
| Other expenses |
3.5 |
3.5 |
0.0 |
101.3 |
163.7 |
65.8 |
13.0 |
| Total expenses |
27.3 |
26.9 |
-0.4 |
785.7 |
1,261.4 |
479.2 |
100.0 |
Note: ‘Change’ refers to the total change between 2025-26 to 2035-36. Numbers may not sum due to rounding.
Defence expenses/spending from 2025-26 to 2028-29 is based on the 2025-26 Budget estimates. For 2029-30 to 2033-34, the PBO has assumed growth rates as per public medium-term projections of defence funding that were published in the 2024-25 Budget, BP1 (Chart 3.9). For 2034-35 and 2035-36, the PBO has assumed growth in defence spending would be maintained at the average rate for the rest of the medium-term.
For more explanation of these and other terms, see the PBO’s Online budget glossary.
Accrual accounting
Accrual accounting records income when it is earned, and records costs when they are incurred, regardless of when the related cash is received or paid. Under accrual accounting, government income is called ‘revenue’ and costs are generally called ‘expenses’. As an example, under accrual accounting, goods and services tax revenue is recorded in the financial year that the goods and services are purchased, even though the government may not receive the related tax amounts until the following financial year.
Cash accounting
Cash accounting records income when cash is received, and records costs when cash is paid out, regardless of when those amounts are earned or incurred. For example, under cash accounting, goods and services tax receipts are recorded in the financial year they are received, even though those tax amounts may relate to goods and services purchased in the previous financial year. Under cash accounting, government income is called ‘receipts’ and costs are called ‘payments’.
Expenses
Expenses in the budget context refers to the cost of providing government services, excluding costs related to revaluations such as the write down of assets. Examples include spending on programs such as the Age Pension or Medicare, funding provided to the states and territories for public hospitals, or the wages paid to Australian Government employees.
Fiscal balance
The fiscal balance is an accrual accounting measure of the budget balance equal to the government's revenue (for example from taxes) minus its expenses (from providing services such as Medicare and income support such as the Age Pension), adjusted for government capital investments such as military equipment (known as 'net capital investment in non-financial assets') when they are acquired or sold.
Fiscal sustainability
The government’s ability to maintain its long-term fiscal policy arrangements indefinitely, without the need for major remedial policy action. A fiscally sustainable position is one which can be maintained while pursuing similar borrowing and repayment approaches over the long term, such that taxation and spending can be expected to operate within reasonable and expected bounds.
Gross debt
In the budget papers, gross debt is the sum of interest-bearing liabilities, consisting of Australian Government Securities on issue, based on their value when the securities were issued (their 'face value'). Gross debt does not include any of the government’s financial assets that partly offset that debt, or any smaller debts that are not Australian Government Securities.
Headline cash balance
The headline cash balance (HCB) is a cash measure of the budget balance equal to the government's receipts (for example from tax collections) minus payments for operations and investment activities (including certain investments in financial assets). If receipts are lower than payments, the headline cash balance is in deficit, meaning the government does not have sufficient cash to cover its activities and must borrow from financial markets.
Interest payments
Interest payments are the cash payments on the government’s debt liabilities which are recorded as a cost to government in the budget. Net interest payments are equal to interest payments minus the cash interest receipts earned by the government on investments in interest-bearing financial assets.
Net debt
Net debt is the sum of selected financial liabilities (including deposits held, advances received, government securities, loans, and other borrowings) less the sum of selected financial assets (including cash and deposits, advances paid, and investments, loans, and placements). It is a common measure of the strength of a government’s financial position. In the net debt calculation, Australian Government Securities are valued as the price they are currently trading at (their 'market value') rather than their value when the securities were issued (their 'face value').
Net financial worth
Net financial worth measures the total financial assets (such as cash or shares in a company) held by a person or organisation at a fixed point in time, minus the value of any liabilities, such as outstanding debts. Net financial worth is a broader measure of the government's financial position than net debt, but it is narrower than net worth.
Net worth
Net worth measures the government’s overall wealth, calculated as total assets (both financial and non-financial) less total liabilities at a fixed point in time. Net worth is the broadest measure of the government’s financial position.
Payments
Payments capture all outgoing cash transactions from the Australian Government to individuals, organisations, or other levels of government. In the budget context, payments are those that affect the underlying cash balance and comprise cash transactions for operating activities and the purchase of non-financial assets. Examples include an Age Pension payment, a Medicare rebate for a doctor's visit, and the wages of a Centrelink employee.
Interest payments
Interest payments are the cash payments on the government’s debt liabilities which are recorded as a cost to government in the budget. Net interest payments are equal to interest payments minus the cash interest receipts earned by the government on investments in interest-bearing financial assets.
Primary cash balance
The primary cash balance adjusts the underlying cash balance to exclude interest payments on debt as well as interest receipts. As governments have little control over interest payments in the short term (interest payments are largely determined by the size of previous budget deficits), it can be useful to view this as a budget balance that is largely within the government’s control.
Receipts
Receipts are the government's income, recorded at the time they are received as reported on a cash accounting basis. In the budget context, receipts are those that affect the underlying cash balance, so exclude the repayment of loans and other cash flows relating to the exchange of financial assets. Most government receipts are tax receipts, such as company tax, personal income tax, and goods and services tax. The government also receives non-tax receipts, such as interest earned on government loans and dividends from government investments.
Revenue
Revenue is government income, recorded at the time it is earned and reported on an accrual accounting basis. Most government income is made up of tax revenue, such as company tax, personal income tax, and goods and services tax. The government also receives non‑tax revenue, such as interest earned on government loans and dividends from government investments.
Underlying cash balance
The underlying cash balance (UCB) is a cash measure of the budget balance equal to the difference between the government's receipts and its payments. It is one of several indicators known as ‘budget aggregates’ that measure the impact of the government's budget on the economy. When the government or the media say the budget is in surplus or deficit, they are generally referring to the underlying cash balance, or sometimes the net operating balance or fiscal balance. More specifically, the underlying cash balance is equal to the government's receipts (for example from tax collections) minus its payments from providing services (such as Medicare) and support (such as the Age Pension). The types of receipts and payments used in the calculation include those from buying and selling non‑financial assets, such as buildings or equipment. The term ‘underlying’ is used because it excludes some cash transactions that are captured in the broader, but less commonly used, headline cash balance. Appendix A discuss the various budget balances in more detail.
[1] Operational costs (or operating expenses) refer to the ongoing, day-to-day expenses of running government programs and services, such as wages, utilities, supplier payments, and accruing employee entitlement. They exclude capital expenditure on assets and financial transactions.
[2] Reserve Bank of Australia (2025) Bonds and the Yield Curve | Explainer | Education | RBA.
[3] Interest may be considered as a payment related to accumulated past budget balances, meaning that the primary balance may be a more appropriate measure of the government’s current fiscal stance. The PCB also excludes interest receipts – these are much lower than interest payments.
[4] The alternative financing arrangements, while leaving the initial balance sheet position unchanged, may lead to subsequent revaluations that affect net worth. However, these revaluations, don’t affect net cash flows for policy purposes, as discussed in the section. Concessional loans typically include an impairment of the asset on initial recognition, such that the cash flows do not equal the change in the asset position.
[5] Australian Government (2025) 2025-26 Budget, Budget Paper No. 1, Table 3.4: Reconciliation of general government sector underlying and headline cash balance estimates, page 71, Australian Government.
[6] Australian Government (2025) 2025-26 Budget, Budget Paper No. 1, Table 3.4: Reconciliation of general government sector underlying and headline cash balance estimates, page 71, Australian Government.
[7] Reserve Bank of Australia (2025) Statement on Monetary Policy – August 2025.
[8] Consistent with the analysis in Structural trends in GST, the PBO’s projections assume households gradually increase their share of spending on items not subject to GST.
[9] Grattan Institute (2020) No free lunch: higher super means lower wages, page 3, Grattan Institute.
[10] Tax and Transfer Policy Institute (2020) The Economic Incidence of superannuation.
[11] Treasury (2025) Economic Reform Roundtable: Budget sustainability and tax reform.
[12] Melbourne Institute (2024) The Household, Income and Labor Dynamics in Australia Survey: Selected findings from Waves 1 to 22.
[13] For a more detailed discussion, see the PBO’s budget explainer Australia’s Tax Mix, figure 4-3 (page 36).
[14] Treasury (2023) Intergenerational Report.
[15] Population estimates prior to 2021 are taken from the ABS Historical population, from 2023-24 population estimates use the Australian Government Centre for Population 2024 Population Statement.
[16] See the PBO’s budget explainer Australia’s Tax Mix.
[17] See the ATO’s analysis of the ‘Tax gap’, which estimates a shortfall of tobacco excise of $2.3 billion compared to expected collections with full compliance.
[18] Australian Renewable Energy Agency (2025) Electric vehicles.
[19] CSIRO (2025) Electric vehicle projections 2024.
[20] Australian Government (2025) 2025-26 Budget, Budget Paper No. 1, Statement 5: Expense and Net Capital Investment, page 116.
[21] Per the NDIS quarterly report to disability minister Q4 2024-25 summary, 'at 30 June 2025, the yearly rate of growth in NDIS costs had fallen to 10.8%, lower than the growth rate of 12% projected in the NDIA’s Annual Financial Sustainability Report (AFSR) in June 2024’.
[22] On 20 August 2025, Health Minister Mark Butler set a new course of the NDIS, to revise the growth target for NDIS costs by lowering it from 8% to 5-6% a year. In the scenarios, it is assumed that state government contributions to the NDIS would remain consistent with current policy settings. However, under an alternative NDIS growth target, this may involve funding arrangements between the Commonwealth and state governments. If state government contributions were to change, this would alter the fiscal impact. These potential changes were not reflected in the current report. Note that these projections reflect increased state and territory contributions to the funding of the NDIS, as announced at the 2024-25 MYEFO, page 61.
[23] Defence expenses/spending from 2025-26 to 2028-29 is based on the 2025-26 Budget estimates. For 2029-30 to 2033-34, the PBO has assumed growth rates as per public medium-term projections of defence funding that were published in the 2024-25 Budget Paper No.1 (Chart 3.9). For 2034-35 and 2035-36, the PBO has assumed growth in defence spending would be maintained at the average rate for the rest of the medium-term. Note that the definitions of ‘defence spending’ vary between nations, so the percentages of GDP are not directly comparable. The scenarios shown below are illustrative and not intended to show how Australia’s defence spending would increase if it met the same definitions as used by either NATO or the US.
[24] North Atlantic Treaty Organization (NATO), Defence expenditures and NATO’s 5% commitment.
[25] U.S. Department of War (2025), Readout of Secretary of Defence Pete Hegseth's Bilateral Meeting With Australia.
[26] Parliamentary Library (2025),Rising global defence expenditure.
[27] Department of Defence (2024), 2024 National Defence Strategy.
[28] The economic parameter for forecasting departmental costs is typically one of the ‘wage cost indices’, which generally grow slower than forecasts for either wages or prices (CPI). The PBO’s explainer, Indexation & the budget – an introduction, discusses these parameters and their application.
[29] 2025-26 Budget Paper No. 3, page 121.
[30] There are differences in how projections were presented in the 2015-16 edition compared to recent editions. First, the 2015-16 projections were solely on a cash basis, while the projections in recent editions are on an accrual basis. Second, total receipts and payments included sales and purchases of non-financial assets, respectively. As such, the amounts are not strictly comparable. The differences due to the recognition methods are typically small and the comparisons presented here adjust for the differences as much as possible.
[31] The 2015-16 projections were constructed on the historical economic data at the time, which has since been somewhat revised. The amounts discussed here as a percentage of GDP have been adjusted to allow for the historical revisions to GDP, which presents them on a more comparable basis. As such, the 2015-16 projections as a share of GDP shown here differ slightly from those presented in the original report.
[32] Consistent with our legislation, the economic forecasts underpinning all editions of Beyond the budget are identical to those used in the contemporaneous government budgets.
[33] Department of Industry, Science and Resources (2024), Resources and energy earnings to further ease after the record peak in 2022-23, DISR.
[34] Australian Bureau of Agricultural and Resource Economics and Sciences (2023), Agricultural Commodities Report: December quarter 2023, ABARES.
[35] Australian Government (2021) Budget 2021-22 - Factsheet, Australian Government.
[36] A likely additional factor is that the PBO is now using more sophisticated modelling of some payments.
[37] Extract from the Government’s Economic and Fiscal Strategy, Budget Paper No. 1, Statement 3: Fiscal Strategy and Outlook, 2025-26 Budget, page 58.