Summary of policy specification
Reduce the Fuel Tax Credits (FTC) rate by 25%.
- The off-road rate would decrease from an average of 51.7c per litre to 38.8c
- The on-road rate would decrease from an average of 19.3c per litre to 6.4c1
Policy start date: 1 July 2027 | Budget baseline: 2026-27 Budget | Policy topic: Fuel taxation
Summary of policy impact
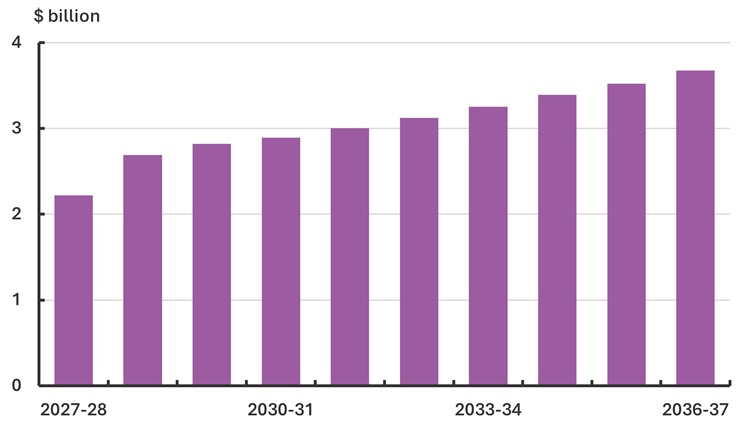
Reducing the FTC rate would improve the underlying cash balance (UCB) by around $7.7 billion over the forward estimates, and $30.6 billion over the medium term. This would be driven by decreases in both government expenses and business income tax revenue, all other things being equal (Figure 1).
Figure 1: Change in underlying cash balance across the medium term
Policy context
Australia’s fuel tax system comprises:
-
Fuel excise, where fuel is taxed at the point of production or importation. Most fuel excise is remitted by large producers of petroleum products to either the Australian Tax Office (for domestic production) or the Department of Home Affairs (for imported fuel). Fewer than 50 businesses are involved which means that collection of the tax is relatively simple.
-
Fuel tax credits (FTCs), where the excise, already paid on fuel used for some business inputs, is returned to the business. Business activities often eligible for FTCs include the operation of non-vehicle machinery such as generators, pumps, kilns and manufacturing equipment, as well as vehicles driving on non-public roads or business premises, such as a warehouse or a site for mining or construction. Fuel used for driving vehicles on public roads2 is generally not eligible for FTCs, with the main exemption being fuel used by vehicles with a gross weight of at least 4.5 tonnes. FTCs are a budget expense, rather than a reduction in tax revenue.
-
The road user charge (RUC), a notional fee only levied on heavy vehicles with gross weight above 4.5 tonnes travelling on public roads. Fuel use in these vehicles is eligible for fuel tax credits.3
-
Good and services tax (GST), is added to the price paid by the end user of the fuel, though those users that are registered for GST can claim back that GST if the fuel is used in the operation of that enterprise.
Historical Context
Oil products were lightly taxed by the Commonwealth from Federation in 1901 until fuel excise on petrol (and not diesel) was introduced in 1929, with the specific purpose of funding road infrastructure using revenue formally earmarked for that purpose.
Diesel excise and rebates were introduced later, before being replaced with the current fuel tax credit scheme in 2006. Rebates and FTCs were originally designed to compensate businesses using machinery and non‑public roads, reinforcing the principle that fuel tax revenue be used for the maintenance of public roads. As a result, households, as the primary users of public roads, bear most of the fuel tax burden in Australia.
Fuel excise collections have, however, not been specifically linked to road funding since 1992, with the tax instead going into consolidated revenue.4 As the link between fuel tax and road funding has weakened, fuel tax has increasingly been used to pursue objectives beyond infrastructure funding. For example, the halving of fuel excise rates for three months from 1 April 2026 in the 2026-27 budget was framed as a cost-of-living relief measure for households in response to oil price shocks from the Iran war, without related adjustment to road funding.5
The PBO’s Budget Explainer, Fuel taxation in Australia, includes further detail on the history and operation of the fuel excise, fuel tax credits and the ‘road user charge’.
Improvements in fuel efficiency, greater use of public transport, and increasing uptake of electric and low emissions vehicles (including plug ins and hybrids) are contributing to an ongoing decline in fuel excise revenue.
The analysis below presents the fiscal impacts of a change to the FTC rate without considering the broader policy rationale for such a change. The fuel tax system might be considered as an avenue to, for example:
- finance funding for roads;
- finance programs to address emissions;
- reduce traffic congestion; or
- raise general revenue.
The policy objective would have implications for the appropriate design of system changes.
Changes to the FTC system would likely lead to varying impacts on different industries. The extent of these impacts would be a function of the importance of FTCs to each industry’s operations; which in turn, is determined by the importance of fuel as an input to an individual businesses’ profitability, and the price and demand elasticity of the goods or services produced. Where possible, business may counter lower profitability by increasing their prices commensurate with the loss of FTCs. This response could lead to higher consumer prices on the goods and services produced by some industries (further explained in Industry overview).
A reduction in FTC rates may create an incentive for businesses to reduce their fuel use. This could lead to an accelerated transition away from internal combustion engine vehicles and machinery in the longer term. Diesel and petrol-reliant machinery and heavy vehicles traveling off public roads, such as those used by the mining and transport industries, would remain large users of these fuels.
Assuming no other changes to the system, reducing FTCs would likely result in either increased consumer prices, when businesses pass the impact through the production chain, or reduced business profitability, for businesses that are unable to pass the impact on. Less profitable businesses may offer lower shareholder returns and lower business tax payments.
Current policy
Under current policy arrangements, notwithstanding the excise rate reduction for 3 months from 1 April 2026, FTC rates for diesel and petrol fuel purchased after 2 February 2026 are:
-
Off-road use, 52.6c per litre (equal to the current fuel excise rate) for business use on non‑public roads; and
-
On-road use, 20.2c per litre for heavy vehicles travelling for business use on public roads.
The difference between the on-road rate of FTCs, compared to the off‑road rate, is the RUC. The current RUC is therefore 32.4c per litre.
The RUC is deducted from the full rate to produce the partial FTC rate for heavy vehicles using public roads (i.e. 52.6c – 32.4c = 20.2c).
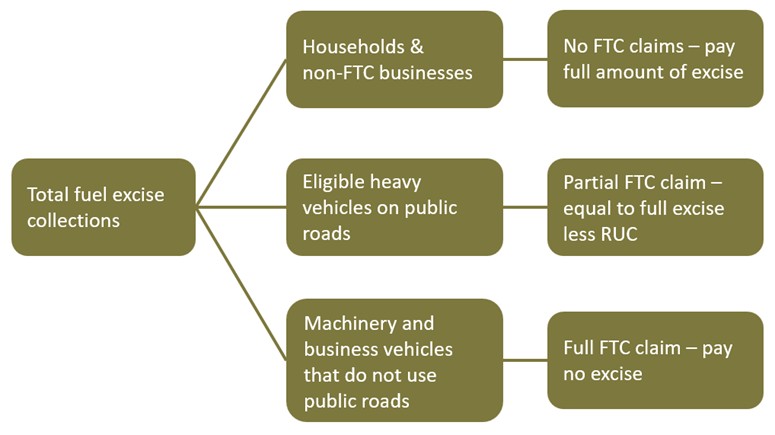
A breakdown of the different ways fuel excise is collected, and in some cases reduced through FTCs, is shown in Figure 2.
Figure 2: Operation of fuel tax credits
Fiscal impact overview
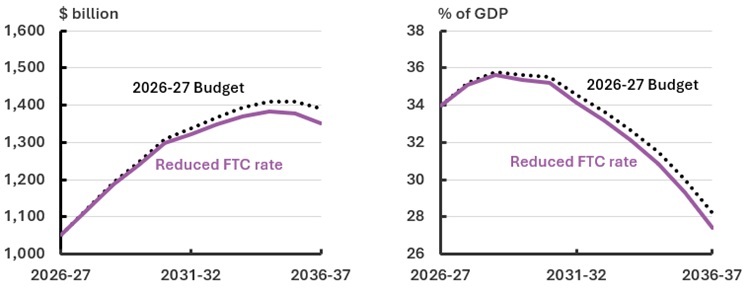
Reducing the FTC rate by 25% from 1 July 2027 would increase the underlying cash balance by around $7.7 billion over the 2026-27 Budget forward estimates period and $30.6 billion over the medium term to 2036-37. This is driven by a reduction in FTC budget expenses, partially offset by a decrease in business tax receipts. Figure 3 demonstrates the impact of this policy on the UCB relative to 2026-27 Budget projections, both in nominal terms and as a share of GDP.
Consistent with standard PBO costing practice, this analysis assumes that all other policy settings remain unchanged. The decrease in expenses arising from the policy is therefore reflected in the underlying cash balance and cumulatively, in government debt and public debt interest.
Without any other changes to expenditure or revenue, this policy would lead to ongoing increases in the underlying cash balance over time, with a compounding improvement to debt. The policy results in $8.4 billion less government debt by the end of the 2026-27 Budget forward estimates period and $38.5 billion less by the end of the medium term (Figure 4).
Figure 3: Underlying cash balance, amount and share of GDP

Figure 4: Gross government debt, amount and share of GDP
PDI impacts are included in the totals for gross debt (Figure 4).
Policy impacts in detail
Changes to fuel tax credit rates alter the extent to which businesses are exposed to the full fuel excise rate. A 25% decrease in the FTC rate could have a larger impact on industries that rely on fuel and road use for their main business activity. This includes industries such as agriculture, forestry and fishing; construction; mining; and transport, postal and warehousing industries.
Table 1 shows the concentration of total and average FTC claims by industry, combined with broader tax data on possible business level impacts. The analysis below illustrates the broad relationship between FTCs and net income tax paid. This analysis highlights the exposure of businesses in certain industries to reductions in FTC rates.
Table 1: Fuel tax credits statistics and impact of policy change, by broad industry, 2023-24(a)
|
Broad industry |
Value of FTC |
Share of total |
Number of FTC claimants |
Average value of FTCs claimed |
Reduction in FTC claims due to policy |
Aggregated net income tax |
Average net income tax paid |
FTC claims as share of net income tax |
|
A. Agriculture, Forestry and Fishing |
1,101 |
11% |
83,820 |
13,134 |
275 |
1,470 |
58,973 |
75% |
|
B. Mining |
4,503 |
47% |
1,666 |
2,702,868 |
1,126 |
46,964 |
6,337,933 |
10% |
|
C. Manufacturing |
379 |
4% |
5,988 |
63,213 |
95 |
8,348 |
147,257 |
5% |
|
D. Electricity, Gas, Water and Waste Services |
243 |
3% |
2,306 |
105,378 |
61 |
2,555 |
536,627 |
10% |
|
E. Construction |
694 |
7% |
27,537 |
25,200 |
174 |
8,162 |
43,879 |
9% |
|
F. Wholesale Trade |
158 |
2% |
4,640 |
34,014 |
40 |
10,221 |
207,487 |
2% |
|
G. Retail Trade |
47 |
0% |
2,901 |
16,158 |
12 |
7,222 |
97,852 |
1% |
|
H. Accommodation and Food Services |
15 |
0% |
1,228 |
12,144 |
4 |
1,595 |
31,857 |
1% |
|
I. Transport, Postal and Warehousing |
1,786 |
19% |
37,281 |
47,895 |
447 |
2,856 |
53,127 |
63% |
|
J. Information Media and Telecommunications |
2 |
0% |
164 |
12,369 |
1 |
2,060 |
115,767 |
0% |
|
K. Financial and Insurance Services |
93 |
1% |
346 |
267,468 |
23 |
29,168 |
168,050 |
0% |
|
L. Rental, Hiring and Real Estate Services |
69 |
1% |
3,073 |
22,392 |
17 |
5,057 |
31,526 |
1% |
|
M. Professional, Scientific and Technical Services |
223 |
2% |
2,006 |
111,051 |
56 |
8,940 |
44,963 |
2% |
|
N. Administrative and Support Services |
84 |
1% |
3,470 |
24,054 |
21 |
1,272 |
32,561 |
7% |
|
O. Public Administration and Safety |
116 |
1% |
703 |
164,703 |
29 |
280 |
38,026 |
41% |
|
P. Education and Training |
6 |
0% |
695 |
9,066 |
2 |
442 |
24,673 |
1% |
|
Q. Health Care and Social Assistance |
2 |
0% |
337 |
5,415 |
1 |
2,436 |
37,745 |
0% |
|
R. Arts and Recreation Services |
7 |
0% |
1,095 |
6,141 |
2 |
806 |
46,122 |
1% |
|
S. Other Services |
65 |
1% |
2,846 |
22,653 |
16 |
936 |
19,425 |
7% |
|
Z. Other |
13 |
0% |
26 |
493,731 |
3 |
1,158 |
138,318 |
1% |
(a) Australian Taxation Statistics 2022-23 Taxation Statistics 2022-23 - Excise - Table 4 - Data.gov.au
Industry overview
Reducing the FTC rate has the direct impact of increasing costs to businesses by making fuel more expensive (by removing an exemption from the tax on fuel that applies to on road use). Businesses may be affected through both general fuel consumption and how connected that fuel use is to their revenue generation.
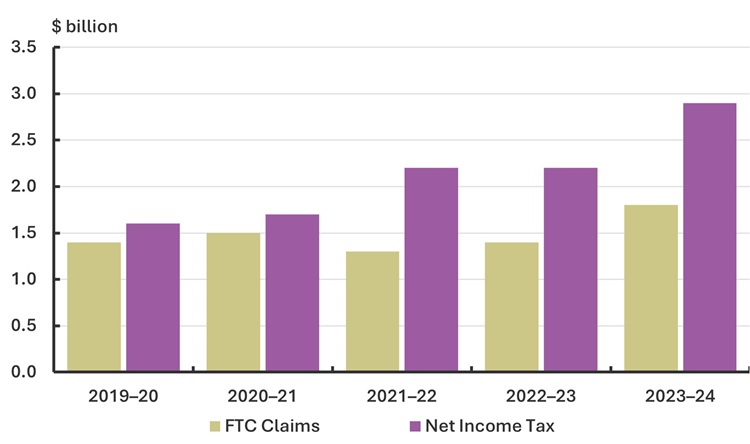
FTC claims were primarily concentrated in 2 industries in 2023-24. Mining, and transport, postal and warehousing, accounted for almost two thirds of all FTC claims in 2023-24. Charts comparing these 2 industries are shown in Figures 5 and 6.
The mining industry claimed the highest volume of FTCs in 2023-24, with a value of $4.5 billion (Table 1). For the mining sector taken as a whole, FTCs are not closely connected with revenue generation and profitability in the way that other sectors might be, such that the value of mining FTC claims is small relative to income tax paid by the industry.
Customers of mining businesses are largely overseas, with prices determined by global commodity markets. The impact on Australian consumers would be largely indirect and may flow through to reductions in dividends, business tax collections and future investment.
Conversely, transport postal and warehousing companies claim fewer total FTCs than the mining industry. However, businesses in this industry have some of the highest proportions of FTC claims as a share of net income tax paid. Fuel use by these companies is more closely connected with their revenue generation. As such, reducing the FTC rate has more potential to make individual businesses in this industry unprofitable if they are unable to increase prices in response to the change.
In response to a reduction in FTCs, transport postal and warehousing businesses would likely pass any cost increases through to their customers. Because transport services are a necessary input to other businesses, these costs may flow through to other sectors and to consumer prices more broadly.
Unlike a policy change that mechanically affects consumer prices, such as an increase to the GST, changes to FTC policy would affect prices through various paths, depending on how businesses respond. This analysis does not assess flow on effects, including the budget impact from increased rates of government payments that are indexed to CPI.
Figure 5: Mining, FTC claims and net income tax receipts, 2019-20 to 2023-24
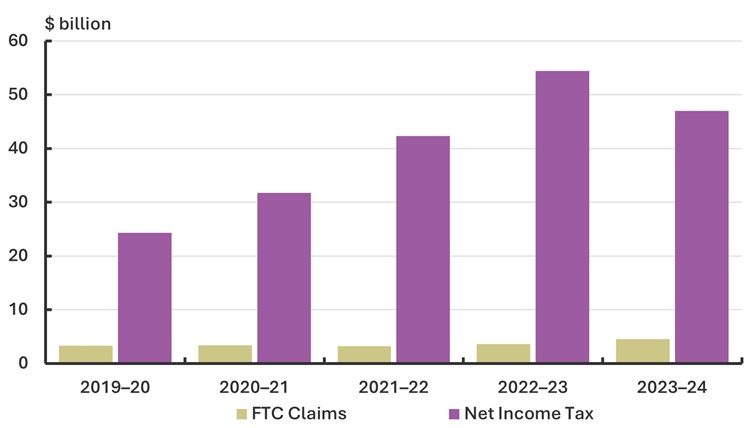
Figure 6: Transport, postal and warehousing, FTC claims and net income tax receipts, 2019-20 to 2023-24
Sensitivity analysis
The financial implications of this policy are sensitive to economic parameter assumptions and the actual volumes of fuel purchased over the medium term. If fuel consumption or related parameters grow faster (or slower) than projected, the resulting improvement to the budget position would be larger (or smaller) than presented here.
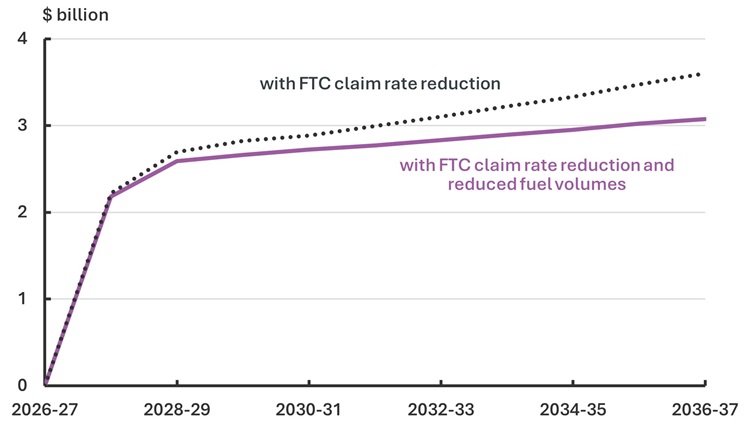
To illustrate this sensitivity, the following analysis considers a scenario with an accelerated uptake of electric vehicles (EVs). Under this scenario, we assume fuel consumption would be 20% lower than current projections by the end of the medium term (2036-37). The impact of a 25 per cent reduction in Fuel Tax Credit (FTC) rates is assessed under both current fuel consumption projections and this lower fuel consumption path.
We assume the accelerated take up of EVs is spread evenly across the fuel consuming population (i.e. households and businesses). As such, the budget impact of a reduced fuel consumption is reduced fuel excise collections, with a corresponding reduction in FTC expenses (before any change to FTC rates).
Figure 7 shows that, relative to Budget projections, lower fuel volumes would reduce the revenue raised from a 25 per cent reduction in FTC rates by $0.4 billion in 2036-37 and $2.9 billion cumulatively over the medium term, on a cash basis. This scenario demonstrates that the policy costing results are robust to this uncertainty: even with a significant decline in fuel use, reduced FTC rates would continue to stabilise future fuel excise shortfalls.
Figure 7: Change in underlying cash balance, sensitivity to fuel volume projections
Our approach
Assumptions
The PBO has made the following assumptions in this analysis.
- The current halving of fuel excise rates from 1 April 2026 would cease before the policy start date.
- The RUC rate would remain constant at 32.4c per litre from 2025-26 to 2036-37.6
- Businesses would not change their fuel consumption as a result of this policy change i.e. the fuel consumption of businesses would be consistent with the 2026-27 Budget through to the medium term.
- Around 85% of FTCs would be claimed during the current tax year, with 15% claimed in the following year.7
- Around 90% of businesses with fuel tax credit claims would be in a taxable position for income tax, with an average marginal tax rate of around 29%.
- Taxable businesses currently claiming FTCs would pay around 92% of their income tax during the year, as instalments, with the remaining 8% paid in the following year.
- The average marginal tax rate of shareholders would be around 29%.
- Shareholders would be Australian resident taxpayers who can claim a tax credit for the franking credits attached to their dividends.
- Shareholders would be individuals, superannuation funds, partnerships, trusts, charities, and other companies.8
- Companies would pay out 50% of their after-tax profits as franked dividends.
Methodology
The financial implications of reducing FTC rates were estimated using data provided by the ATO and publicly available information on fuel excise rates and the RUC. FTC rates were projected over the medium term using the assumptions above and then used to estimate the reduction in total FTCs claimed and paid under the proposal.
The difference in FTC claims leads to increased business costs, which without price increases translate into lower profits and lower business-related income tax revenue for government. The small positive impact on franking credit claims occurs when companies pay out lower dividends. As a result, there will be a reduction in refunds paid out to shareholders from the ATO.
This costing includes first‑round (static) fiscal impacts - reflecting the immediate budgetary effect of the policy - as well as direct behavioural impacts arising from changes in the behaviour of those directly affected. Consistent with the Charter of Budget Honesty and standard PBO costing practice, it does not incorporate broader second‑round economic effects, such as feedback into GDP, employment or wages, which could materially alter budget outcomes.9
Data sources
The Australian Taxation Office provided estimates for Fuel Tax Credit Expenses and Road User Charge revenue as at the 2026-27 Budget.
The Australian Taxation Office provided de-identified Business Activity Statement (BAS) data over the period 2022-23 to 2024-25.
Australian Government (2026), 2026-27 Budget, Canberra: Australian Government.
Australian Government (19 April 2023), Fuel Tax (Road User Charge) Determination 2023.
Australian Taxation Office (2025), Taxation Statistics 2022-23, ATO, Australian Government. Accessed 16 February 2026.
Parliamentary Budget Office (2022), Fuel taxation in Australia, Parliament of Australia.
Parliamentary Budget Office (2026), Build your own Budget, Parliament of Australia.
References
Australian Renewable Energy Regulator (2024) Decarbonising heavy transport is critical to net zero journey - Australian Renewable Energy Agency.
Australian Taxation Office (2026) Current FTC rates From 1 July 2025 to 30 June 2026 | Australian Taxation Office.
National Transport Commission (2026) Road user charges | National Transport Commission.
Parliamentary Budget Office (2024), Shrinking revenue bases in excise taxes, Parliament of Australia.
How can I test other policies?
The PBO’s Build your own Budget (BYOB) is an educational interactive tool that allows you to explore the impact of different economic assumptions and policy settings of your choice.
Attachment A - Financial implications
Table 1: Reduce the rate of fuel tax credits – Fiscal balance(a)(b)
|
|
2026-27 |
2027-28 |
2028-29 |
2029-30 |
2030-31 |
2031-32 |
2032-33 |
2033-34 |
2034-35 |
2035-36 |
2036-37 |
Total to |
Total to |
|
Revenue |
|
|
|
|
|
|
|
|
|
|
|
|
|
|
Tax revenue |
|
|
|
|
|
|
|
|
|
|
|
|
|
|
Income tax revenue |
- |
-880.0 |
-1,010.0 |
-1,060.0 |
-1,080.0 |
-1,120.0 |
-1,170.0 |
-1,220.0 |
-1,270.0 |
-1,320.0 |
-1,380.0 |
-2,950.0 |
-11,510.0 |
|
Franking credit claims |
- |
- |
2.1 |
2.4 |
2.5 |
2.5 |
2.6 |
2.8 |
2.9 |
3.0 |
3.1 |
4.5 |
23.9 |
|
Total – tax revenue |
- |
-880.0 |
-1,007.9 |
-1,057.6 |
-1,077.5 |
-1,117.5 |
-1,167.4 |
-1,217.2 |
-1,267.1 |
-1,317.0 |
-1,376.9 |
-2,945.5 |
-11,486.1 |
|
Expenses |
|
|
|
|
|
|
|
|
|
|
|
|
|
|
Fuel Tax Credit Scheme |
- |
3,540.0 |
3,710.0 |
3,890.0 |
3,980.0 |
4,150.0 |
4,320.0 |
4,500.0 |
4,680.0 |
4,870.0 |
5,070.0 |
11,140.0 |
42,710.0 |
|
Total (excluding PDI) |
- |
2,660.0 |
2,702.1 |
2,832.4 |
2,902.5 |
3,032.5 |
3,152.6 |
3,282.8 |
3,412.9 |
3,553.0 |
3,693.1 |
8,194.5 |
31,223.9 |
(a) A positive number for the fiscal balance indicates an increase in revenue or a decrease in expenses or net capital investment in accrual terms. A negative number for the fiscal balance indicates a decrease in revenue or an increase in expenses or net capital investment in accrual terms.
(b) Financial implications were rounded consistent with the PBO’s rounding rules.10
- Indicates nil.
Table 2: Reduce the rate of fuel tax credits – Underlying cash balance(a)(b)
|
|
2026-27 |
2027-28 |
2028-29 |
2029-30 |
2030-31 |
2031-32 |
2032-33 |
2033-34 |
2034-35 |
2035-36 |
2036-37 |
Total to |
Total to |
|
Receipts |
|
|
|
|
|
|
|
|
|
|
|
|
|
|
Tax receipts |
|
|
|
|
|
|
|
|
|
|
|
|
|
|
Income tax revenue |
- |
-810.0 |
-1,000.0 |
-1,050.0 |
-1,080.0 |
-1,120.0 |
-1,170.0 |
-1,220.0 |
-1,260.0 |
-1,320.0 |
-1,370.0 |
-2,860.0 |
-11,400.0 |
|
Franking credit claims |
- |
- |
2.1 |
2.4 |
2.5 |
2.5 |
2.6 |
2.8 |
2.9 |
3.0 |
3.1 |
4.5 |
23.9 |
|
Total – tax receipts |
- |
-810.0 |
-997.9 |
-1,047.6 |
-1,077.5 |
-1,117.5 |
-1,167.4 |
-1,217.2 |
-1,257.1 |
-1,317.0 |
-1,366.9 |
-2,855.5 |
-11,376.1 |
|
Payments |
|
|
|
|
|
|
|
|
|
|
|
|
|
|
Fuel Tax Credit Scheme |
- |
3,030.0 |
3,690.0 |
3,870.0 |
3,970.0 |
4,120.0 |
4,290.0 |
4,470.0 |
4,650.0 |
4,840.0 |
5,040.0 |
10,590.0 |
41,970.0 |
|
Total (excluding PDI) |
- |
2,220.0 |
2,692.1 |
2,822.4 |
2,892.5 |
3,002.5 |
3,122.6 |
3,252.8 |
3,392.9 |
3,523.0 |
3,673.1 |
7,734.5 |
30,593.9 |
(a) A positive number for the underlying cash balance indicates an increase in receipts or a decrease in payments or net capital investment in cash terms. A negative number for the underlying cash balance indicates a decrease in receipts or an increase in payments or net capital investment in cash terms.
(b) Financial implications were rounded consistent with the PBO’s rounding rules.11
- Indicates nil.
Table 3: Reduce the rate of fuel tax credits – Memorandum item: Public Debt Interest (PDI) impacts Fiscal and underlying cash balances(a)(b)(c)
|
|
2026-27 |
2027-28 |
2028-29 |
2029-30 |
2030-31 |
2031-32 |
2032-33 |
2033-34 |
2034-35 |
2035-36 |
2036-37 |
Total to |
Total to |
|
Fiscal balance |
- |
50.0 |
180.0 |
320.0 |
470.0 |
630.0 |
800.0 |
980.0 |
1,180.0 |
1,390.0 |
1,620.0 |
550.0 |
7,620.0 |
|
Underlying cash balance |
- |
40.0 |
140.0 |
280.0 |
430.0 |
580.0 |
750.0 |
930.0 |
1,120.0 |
1,330.0 |
1,560.0 |
460.0 |
7,160.0 |
(a) As this table is presented as a memorandum item, these figures are not reflected in the totals in the tables above. This is consistent with the approach taken in the budget where the budget impact of most measures is presented excluding the impact on PDI. If the reader would like a complete picture of the total aggregate, then these figures would need to be added to the figures above. For further information on government borrowing and financing please refer to the PBO’s online budget glossary.12
(b) A positive number for the fiscal balance indicates an increase in revenue or a decrease in expenses or net capital investment in accrual terms. A negative number for the fiscal balance indicates a decrease in revenue or an increase in expenses or net capital investment in accrual terms. A positive number for the underlying cash balance indicates an increase in receipts or a decrease in payments or net capital investment in cash terms. A negative number for the underlying cash balance indicates a decrease in receipts or an increase in payments or net capital investment in cash terms.
(c) Financial implications were rounded consistent with the PBO’s rounding rules.
- Indicates nil.
[1] Inclusive of the Road User Charge of 32.4c per litre
[2] Including toll roads, see Travelling on public roads | Australian Taxation Office
[3] The RUC is administered via a reduction in the fuel tax credits businesses receive, rather than as an additional charge
[4] Since 2014, some amounts, equal to the additional increase in fuel excise collection due to indexation, have been transferred to States and Territories via the Fuel Indexation (Road Funding) Special Account for expenditure in relation to Australian road infrastructure investment see Fuel Indexation Bill 2015.
[5] See Taking Pressure Off Australians – temporary reduction of fuel excise and heavy vehicle road user charge, 2026-27 Budget Paper no 2, page 16 for more details.
[6] The heavy vehicle road user charge will increase by 6% each year over 3 years from 28.8 cents per litre for petrol and diesel in 2023–24, to 30.5 cents per litre in 2024–25 and to 32.4 cents per litre in 2025–26. Refer to: Australian Government (19 April 2023), Fuel Tax (Road User Charge) Determination 2023, available at: https://www.legislation.gov.au/Details/F2023L00681.
[7] This is based on historic FTC claims made via business activity statements, and their associated lodgement timing.
[8] This is based on the weighted distribution of dividend recipients in the Australian Taxation Office’s (ATO’s) 2020-21 Taxation Statistics, applying 2024-25 rates and thresholds. This assumption incorporates the impact of the Stage 3 tax cuts taking effect from 1 July 2024.
[9] www.pbo.gov.au/for-parliamentarians/how-we-analyse/including-broader-economic-effects-policy-costings
[10] www.pbo.gov.au/for-parliamentarians/how-we-analyse/pbo-rounding-rules
[11] www.pbo.gov.au/for-parliamentarians/how-we-analyse/pbo-rounding-rules