Summary of policy specification
Increase the rate of the goods and services tax (GST) from 10% to 15%.
Policy start date: 1 July 2027 | Budget baseline: 2026-27 Budget | Policy topic: Goods and services tax (GST)
Summary of policy impact
Increasing the GST to 15% from 1 July 2027 would generate around $54 billion in additional tax receipts in 2027-28 and around $85 billion by 2036‑37 (Figure 1). Under current arrangements, this additional revenue would be expected to be passed on to the Australian states and territories (states), resulting in no direct change to the Commonwealth’s budget balance. Increasing the GST would result in a one-off increase to the Consumer Price Index (CPI). The CPI increase would lead to higher government expenditure through CPI‑indexed payments, including JobSeeker and the Age Pension.
Figure 1: Change in receipts and payments across the medium term
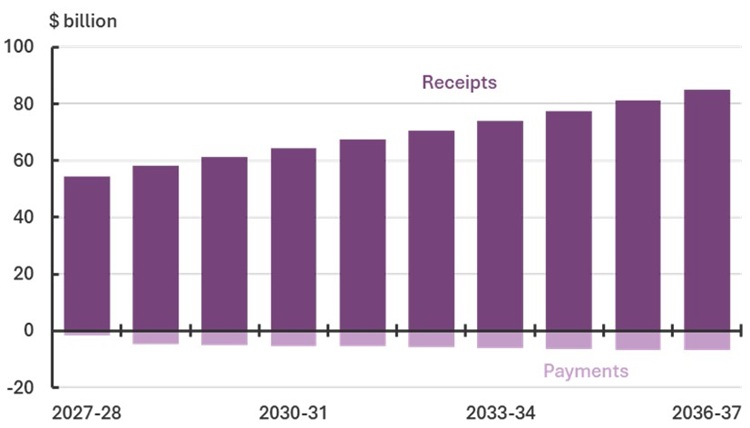
Note: In this analysis, additional GST receipts are passed through to the states; however, these payments are not included in the payment totals in Figure 1.
Policy context
The GST levies a uniform consumption tax rate of 10% on most supplies of goods and services. Some consumption categories like fresh food, rent, education, childcare and health are exempt from GST. The GST is a legislated Commonwealth tax, with all revenue distributed to states. Each year, the Commonwealth Grants Commission calculates how the GST pool will be shared among the states.
Under Commonwealth legislation and Commonwealth-State agreements, changes to the GST rate or base (such as making an item GST free) require the unanimous agreement of the states. Although minor adjustments have been made to the goods and services covered by the GST (the base), the GST rate has not changed since it was introduced on 1 July 2000.
GST collections have fallen from a peak of 3.9% as a share of GDP in 2003-04, and from 15.9% as share of total Commonwealth revenue in 2009-10 to 3.4% of GDP and 13.0% of total Commonwealth revenue in 2025-26.1
GST is generally considered to be an efficient tax;2 it applies a single rate to a broad range of goods and services and raises revenue while causing relatively small changes in economic behaviour. The OECD average rate for value added taxes (VATs) such as the GST is around 19%, with the lowest rate at 5% and the highest at 27%.
This costing analysis focuses on the impacts of raising the GST rate. This analysis does not consider other GST reform options, including broadening the base by removing exemptions or introducing differential GST rates for selected goods and services. It also does not consider broader reforms that would be likely to be considered along-side any change to the GST.
Fiscal impact overview
If the additional GST revenue was all passed through to the states, consistent with current arrangements, then raising the GST and allocating GST revenue to the states would decrease the Commonwealth’s underlying cash balance (a deterioration in the budget position) by around $9.2 billion over the 2026-27 Budget forward estimates period. This cost is associated with increases to transfer payments resulting from CPI increases.
The overall net revenue gain – GST and indexed revenue raised minus increases to indexed transfer payments, grants and subsidies – would be $55.7 billion in 2027-28.
Consistent with standard PBO costing practice, this analysis assumes that while additional revenue raised would be distributed to the states, all other policy settings remain unchanged. In practice, any change in the GST would likely be coupled with other changes, for example to other payments to the states or other taxes or income support payments.
Figure 2 shows the impact on the underlying cash balance as projected in the 2026-27 Budget, both in nominal terms and as a share of GDP. If the additional GST were passed on to the States, then the impact of the change would be slightly negative for the Commonwealth (the dark purple lines), owing to increased welfare payments. If the Commonwealth kept the additional GST raised, the underlying cash balance and debt position would be much improved (the light purple lines).
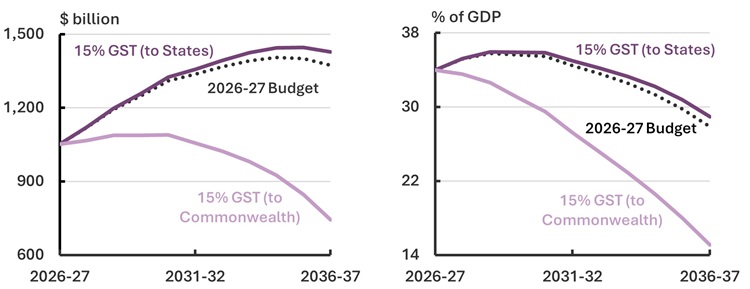
Higher government payments would increase Commonwealth government debt over time relative to the baseline by $9.6 billion by the end of the 2026-27 Budget forward estimates period and $54.4 billion by the end of the medium term to 2036-37 (Figure 3).
Figure 2: Underlying cash balance, amount and share of GDP
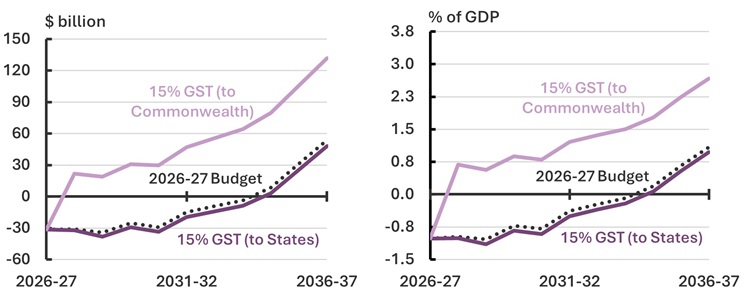
Figure 3: Gross government debt, amount and share of GDP
PDI impacts are included in the totals for gross debt (Figure 3).
If additional GST receipts ($171.4 billion over the forward estimates and $683.9 billion over the medium term) is passed on to the states, this could enable state governments to reduce outstanding debt or direct additional revenue to other priorities including recurrent expenditure or infrastructure priorities.3 In contrast, Commonwealth government debt would increase slightly due to higher payments. These impacts are illustrative only as GST could be allocated between the Commonwealth and states on an alternative basis, or other Commonwealth payments to the states (mainly specific purpose payments) could be modified as part of a package of changes that could allow the Commonwealth to retain a share of the increased GST. This analysis is sensitive to the allocation of additional GST revenue, further discussed in Sensitivity Analysis.
Policy impacts in detail
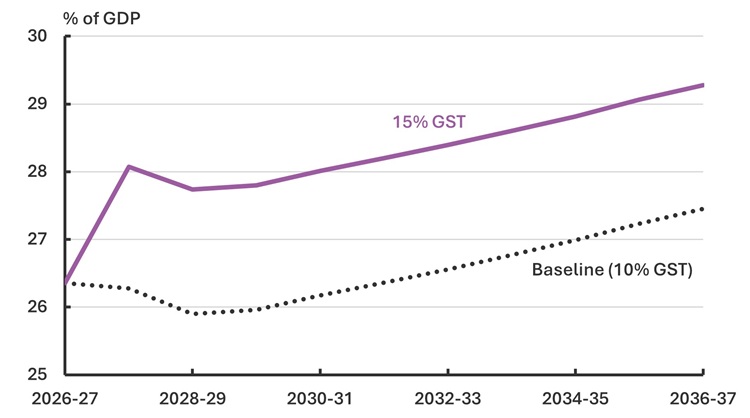
The policy would result in an ongoing increase in total tax revenue across the forward estimates and medium term period, immediately rising to around 28.1% of GDP in 2027-28 from a baseline of around 26.3% of GDP (Figure 4).
Figure 4: Total tax revenue impact as a percentage of GDP
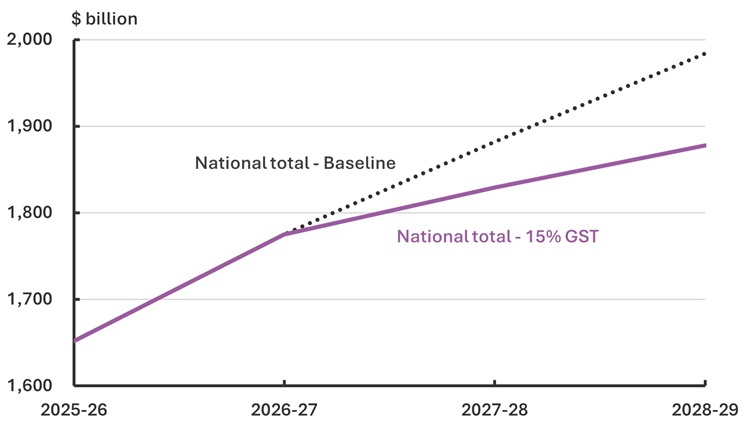
Assuming the GST revenue was allocated to the states, and additional expenditure was paid by the Commonwealth, then Commonwealth gross debt as a percentage of GDP would increase slightly over the forward estimates. Total state gross debt would be lower by around $111.2 billion (a decrease of 14.1%) by 2028-29, as a result of the additional GST from the Commonwealth, assuming no changes to state spending.4 Total national debt (state plus Commonwealth gross debt) would $106.0 billion lower by 2028-29, a decrease of around 5.3% (Figure 5).
Figure 5: Total national gross debt across the forward estimates5
GST impact on the CPI and related government payments
This analysis assumes full pass‑through of GST changes to the CPI. Under this assumption, a 5 percentage point increase in the GST rate would result in a one-off increase in CPI growth by 2.3 percentage points in 2027-28, reflecting the fact that not all goods and services are subject to GST.
If the additional GST revenue is fully passed on to the states, there is a net decrease to the underlying cash balance due higher CPI increasing government payments (such as the Age Pension and JobSeeker), which are indexed to CPI.6 The increase in payments is partially offset by a small increase in revenue from indexation of excise rates.
Consistent with the Charter of Budget Honesty, the PBO does not include broader economic effects of proposals such as changes to productivity or interest rates. However, assuming inflation expectations remain anchored, the Reserve Bank of Australia would not be expected to respond to this price increase, similar to the approach taken at the introduction of the GST in 2000.
Impact on households
The following analysis is on the basis of income quintiles. Income quintiles do not consider wealth holdings or changes in income support payments that would result from automatic indexation related to CPI changes. Specifically, it does not account for low-income households with high assets, such as some older aged households, that appear in the lower-income deciles.
On average, a 5% GST increase would result in households incurring around an additional $4,825 in GST on their spending in 2027-28. The impact varies across income cohorts,7 reflecting differences in consumption patterns, interactions with government payments and other factors.
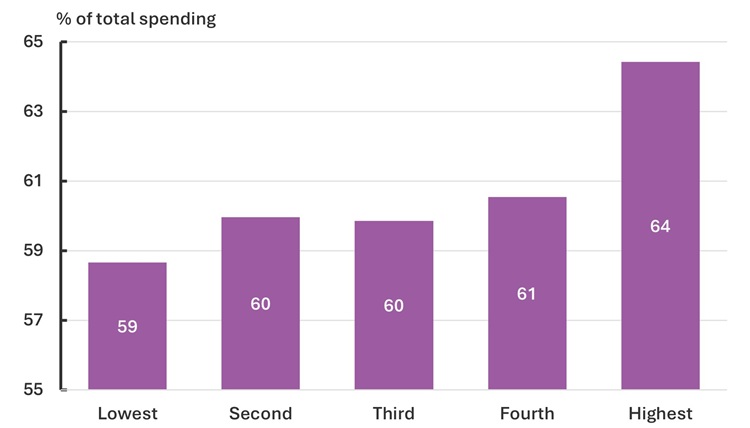
In 2015-16, the most recent year of the Household Expenditure Survey, spending by households in the lowest income quintile on items subject to GST was 59% of their total spending, compared to 64% for households in the highest income quintile (Figure 6). The smaller share of spending by the lowest income quintile reflects a high share of spending on items related to GST-free categories such as health and fresh food. In dollar terms, GST raised from spending by households in the lowest income quintile is far below households in the highest income quintile.
Figure 6: Share of spending subject to GST in 2015-16, by income quintile
The increase to a household’s government benefits from higher indexation would vary depending on the payment and the number of people in the household receiving the payments. For example, for full rate pension recipients the fortnightly rate for 2028-29 would increase from $1,311 to $1,334 whereas fortnightly payments for full rate Jobseeker recipients in 2028-29 would increase from $900 to $920. The total fortnightly combined payment for a household with both recipients receiving the partnered pension payment would increase from $1,977 to $2,011.
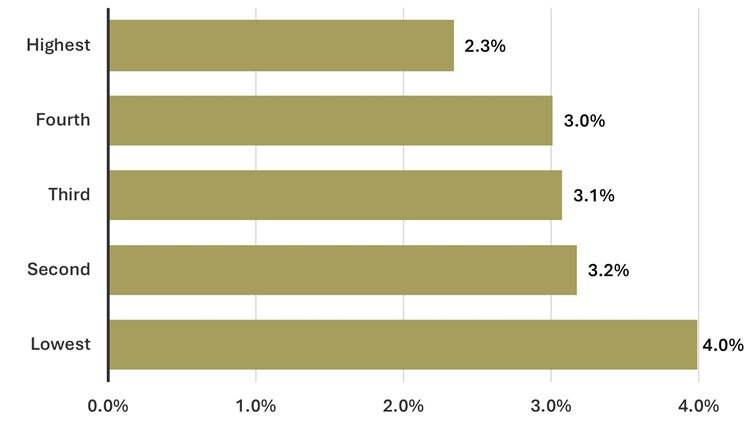
Over the costing period, the highest income quintile households would contribute around 33.6% of the total additional GST revenue, compared to around 11.3% for the lowest income quintile. However, when measured relative to disposable income, the total additional GST burden is higher for the lowest income quintile, at 4.0% of their total income over the medium term, compared to 2.3% for the highest income quintile (Figure 7).
These impacts do not capture household assets and wealth, or the effect of government payments indexation which would offset some of the additional GST paid. Additionally, when the GST was introduced on 1 July 2000, the government provided income tax cuts and increases to welfare payment rates to compensate for the effect on the price of many goods and services.
As occurred with the introduction of the GST in 2000, direct household compensation could be provided to mitigate the impact of a GST rate change; such compensation is not included in this analysis. Distributional impacts on households are best considered within the context of the tax system as a whole, as discussed in Australia’s Tax Mix.
Figure 7: Total additional GST as a percentage of total gross disposable income over the medium term, by income quintile8
High-income households pay a smaller share of their income on GST given the higher share of income that goes to saving, compared to lower-income households. Households with high wealth and low income spend a higher percentage of their income on GST.
Spending by high-income households tends to slightly favour items subject to GST more than for low-income households. This is because housing costs (rent and mortgage repayments) are not subject to GST but are a larger fraction of spending for low-income households compared to high income households.
Sensitivity analysis
The financial implications for the Commonwealth are sensitive to the allocation of additional GST revenue. In this analysis, the additional revenue is assumed to be passed on to the states.
If all additional GST revenue is allocated to the states, Commonwealth payments to the states would increase by the same amount. The associated increase in the CPI would increase indexed Commonwealth payments, resulting in a decrease in the underlying cash balance.
Under an alternative scenario in which the Commonwealth retains the additional GST revenue, the underlying cash balance would increase (improve), partially offset by the increase in indexed Commonwealth payments due to the increase in the CPI.
Where all additional GST revenue is allocated to the states, gross debt as a percentage of GDP would increase slightly (by 1.1 percentage point) over the medium term. Under the alternative scenario, in which the Commonwealth retains the additional GST revenue, gross debt as a percentage of GDP would decrease by 12.8 percentage points over the medium term.
Alternative scenarios for the allocation of additional GST revenue in conjunction with other changes to Commonwealth payments to states are not explored in this publication. For example, a decrease to other Commonwealth specific payments to states in conjunction with all additional GST revenue going to states would change the financial implications for the Commonwealth.
Our approach
Uncertainties
The PBO has not included a behavioural response associated with an increase in the GST. There is a degree of uncertainty around the impacts of changes on consumption patterns which could have a minor affect the financial implications.
The introduction of the 10% GST in 2000 appeared to have a relatively small net effect on consumption, with some bring-forward of consumption on retail items offset by deferral of other purchases.9
The distributional analysis is based on the data from Australian National Accounts (Distribution of Household Income, Consumption and Wealth 2021-22) and the 2015-16 Household Expenditure Survey. In the absence of other information, we have assumed that the current and future distribution of household spending is consistent with these datasets. The reliability of this assumption diminishes over time as consumer spending patterns evolve.
Assumptions
The PBO has made the following assumptions in costing this policy.
- The baseline economic parameters, presented in Table 1, are consistent with the 2026 27 Budget and do not include the impact of the modelled 5 percentage point increase in the GST rate. The medium-term projections are broadly in line with long-run trends.10
Table 1: Economic parameters
|
|
Forecasts |
Projections |
|||
|
|
2026-27 |
2027-28 |
2028-29 |
2029-30 |
2030-31 to 2036-37 |
|
Nominal GDP |
4¼ |
2¾ |
4¾ |
5¼ |
5.0 |
|
Consumer price index |
2½ |
2½ |
2½ |
2½ |
2.5 |
|
Wage price index |
3½ |
3½ |
3½ |
3¾ |
3.75 |
|
Employment |
1½ |
1¾ |
1¾ |
1¾ |
1.2 |
Source: 2026-27 Budget and PBO’s Build your own Budget tool.
Note: Real GDP and nominal GDP are percentage change on preceding year. Employment, the consumer price index and the wage price index are through-the-year growth to the June quarter. The unemployment rate is the rate for the June quarter.
- Existing GST exemptions and the GST registration threshold would remain unchanged.
- All price rises from the GST rate change would be passed through the production chain immediately and are fully borne by final consumers.
- Households would not bring forward consumption to purchase goods and services before the GST rate change. Additionally, there would be no change to consumption following the GST rate change, including no substitution between GST‑free items and those subject to higher GST rates.
Methodology
The financial implications of increasing the GST rate were estimated by altering the profile of PBO’s projections in a modified version of the PBO’s Build your own Budget tool.
The distributional analysis was calculated using the ABS publication Australian National Accounts: Distribution of Household Income, Consumption and Wealth (2021-22) and the PBO’s Build your own Budget tool.
- To identify the additional GST per household the increased GST collections is divided by the number of households in the ABS survey (based on the number of households in the Census), grown at the Series II rate from the ABS’s 2024 publication Household and Family Projections, Australia.
- Consumption is scaled upwards to reflect current national accounts consumption data, while income quintiles are increased in line with average weekly ordinary time earnings.
This costing includes first‑round (static) fiscal impacts - reflecting the immediate budgetary effect of the policy - as well as direct behavioural impacts arising from changes in the behaviour of those directly affected. Consistent with the Charter of Budget Honesty and standard PBO costing practice, this costing does not incorporate broader second‑round economic effects, such as feedback into GDP, employment or wages, which could materially alter budget outcomes.
Data sources
Australian Bureau of Statistics (2026) Australian National Accounts: National Income, Expenditure and Product, accessed 18 May 2026.
Australian Bureau of Statistics (2022) Australian National Accounts: Distribution of Household Income, Consumption and Wealth, accessed 18 May 2026.
Australian Bureau of Statistics (2024) Household and Family Projections, Australia, accessed 18 May 2026.
Australian Bureau of Statistics (2017) Household Expenditure Survey, Australia: Summary of Results (2015-16), accessed 18 May 2026.
Australian Capital Territory Government (2026) 2025-26 Budget Review, accessed 19 May 2026.
Commonwealth of Australia (2026) 2026-27 Budget, Commonwealth of Australia.
Department of Treasury and Finance (2025) Mid-Year-Budget-Review-2025-26, Government of South Australia, accessed 19 May 2026.
Government of Western Australia (2026) 2026-27 Budget Papers | Western Australia State Budget, accessed 19 May 2026.
New South Wales Government (2026) 2025–26 Half-Yearly Review, accessed 19 May 2026.
Northern Territory Government (NT) (2026) 2026-27 NT Budget, accessed 19 May 2026.
Queensland Treasury (2025) 2025-26 Mid-year Fiscal and Economic Review, accessed 19 May 2026.
Services Australia provided the Services Australia Funding Model Unit prices as at 2026-27 Budget.
The Treasury provided economic parameters as at 2026-27 Budget.
Treasury and Finance Tasmania (2026) 2026-27 Tasmanian Budget, Tasmanian Government, accessed 19 May 2026.
Victoria State Government (2026) Budget 2026/27 | Victorian Budget 26/27, accessed 19 May 2026.
The PBO used a version of Build your own Budget modified specifically for this response.11
References
Australian Taxation Office (2021) GST-free sales, accessed 18 May 2026.
Commonwealth Grants Commission (2026) About GST distribution, accessed 18 May 2026.
Debelle (2018) Speech from RBA Deputy Governor: Twenty-five Years of Inflation Targeting in Australia, Reserve Bank of Australia, accessed 18 May 2026.
de Mooij, Hebous and Keen (2025) Efficiency Aspects of the Value Added Tax working paper, International Monetary Fund, accessed 18 May 2026.
Can I replicate this analysis?
The PBO’s Build your own Budget (BYOB) is an educational interactive tool that allows you to explore the impact of different economic assumptions and policy settings of your choice.
It can be used to explore the impact of different GST rates, as well as changing the base of GST to cover categories that are currently exempt from GST or add exemptions to some categories.
Attachment A - Financial implications
Table A1: Increasing the GST rate – Fiscal balance(a)(b)
|
|
2026-27 |
2027-28 |
2028-29 |
2029-30 |
2030-31 |
2031-32 |
2032-33 |
2033-34 |
2034-35 |
2035-36 |
2036-37 |
Total to |
Total to |
|
Revenue |
|
|
|
|
|
|
|
|
|
|
|
|
|
|
Tax revenue |
|
|
|
|
|
|
|
|
|
|
|
|
|
|
GST |
- |
56,900.0 |
60,400.0 |
63,600.0 |
66,900.0 |
70,200.0 |
73,600.0 |
77,100.0 |
80,700.0 |
84,600.0 |
88,600.0 |
180,900.0 |
722,600.0 |
|
Indexed revenue: Fuel and alcohol excise |
- |
340.0 |
860.0 |
900.0 |
940.0 |
960.0 |
990.0 |
1,020.0 |
1,050.0 |
1,100.0 |
1,120.0 |
2,100.0 |
9,280.0 |
|
Total – revenue |
- |
57,240.0 |
61,260.0 |
64,500.0 |
67,840.0 |
71,160.0 |
74,590.0 |
78,120.0 |
81,750.0 |
85,700.0 |
89,720.0 |
183,000.0 |
731,880.0 |
|
Expenses |
|
|
|
|
|
|
|
|
|
|
|
|
|
|
Administered |
|
|
|
|
|
|
|
|
|
|
|
|
|
|
GST grants to states |
- |
-54,000.0 |
-57,200.0 |
-60,200.0 |
-63,300.0 |
-66,400.0 |
-69,600.0 |
-73,000.0 |
-76,400.0 |
-80,000.0 |
-83,800.0 |
-171,400.0 |
-683,900.0 |
|
Indexed grants and subsidies |
- |
-54.0 |
-481.0 |
-514.0 |
-536.0 |
-557.0 |
-580.0 |
-604.0 |
-628.0 |
-654.0 |
-681.0 |
-1,049.0 |
-5,289.0 |
|
Indexed other administered programs |
- |
-1,490.0 |
-4,250.0 |
-4,500.0 |
-4,740.0 |
-4,950.0 |
-5,300.0 |
-5,520.0 |
-5,740.0 |
-6,010.0 |
-6,230.0 |
-10,240.0 |
-48,730.0 |
|
Departmental |
|
|
|
|
|
|
|
|
|
|
|
|
|
|
Services Australia |
- |
-5.0 |
- |
- |
- |
- |
- |
- |
- |
- |
- |
-5.0 |
-5.0 |
|
Australian Taxation Office |
- |
-2.0 |
-2.4 |
-2.7 |
-3.6 |
-4.3 |
-5.0 |
-5.3 |
-5.0 |
-5.1 |
-5.3 |
-7.1 |
-40.7 |
|
Total – expenses |
- |
-55,551.0 |
-61,933.4 |
-65,216.7 |
-68,579.6 |
-71,911.3 |
-75,485.0 |
-79,129.3 |
-82,773.0 |
-86,669.1 |
-90,716.3 |
-182,701.1 |
-737,964.7 |
|
Total (excluding PDI) |
- |
1,689.0 |
-673.4 |
-716.7 |
-739.6 |
-751.3 |
-895.0 |
-1,009.3 |
-1,023.0 |
-969.1 |
-996.3 |
298.9 |
-6,084.7 |
(a) A positive number for the fiscal balance indicates an increase in revenue or a decrease in expenses or net capital investment in accrual terms. A negative number for the fiscal balance indicates a decrease in revenue or an increase in expenses or net capital investment in accrual terms.
(b) Financial implications were rounded consistent with the PBO’s rounding rules.12
- Indicates nil.
Table A2: Increasing the GST rate – Underlying cash balance(a)(b)
|
|
2026-27 |
2027-28 |
2028-29 |
2029-30 |
2030-31 |
2031-32 |
2032-33 |
2033-34 |
2034-35 |
2035-36 |
2036-37 |
Total to |
Total to |
|
Receipts |
|
|
|
|
|
|
|
|
|
|
|
|
|
|
Tax receipts |
|
|
|
|
|
|
|
|
|
|
|
|
|
|
GST |
- |
54,000.0 |
57,200.0 |
60,200.0 |
63,300.0 |
66,400.0 |
69,600.0 |
73,000.0 |
76,400.0 |
80,000.0 |
83,800.0 |
171,400.0 |
683,900.0 |
|
Indexed revenue: Fuel and alcohol excise |
- |
340.0 |
860.0 |
900.0 |
940.0 |
960.0 |
990.0 |
1,020.0 |
1,050.0 |
1,100.0 |
1,120.0 |
2,100.0 |
9,280.0 |
|
Total – receipts |
- |
54,340.0 |
58,060.0 |
61,100.0 |
64,240.0 |
67,360.0 |
70,590.0 |
74,020.0 |
77,450.0 |
81,100.0 |
84,920.0 |
173,500.0 |
693,180.0 |
|
Payments |
|
|
|
|
|
|
|
|
|
|
|
|
|
|
Administered |
|
|
|
|
|
|
|
|
|
|
|
|
|
|
GST grants to states |
- |
-54,000.0 |
-57,200.0 |
-60,200.0 |
-63,300.0 |
-66,400.0 |
-69,600.0 |
-73,000.0 |
-76,400.0 |
-80,000.0 |
-83,800.0 |
-171,400.0 |
-683,900.0 |
|
Indexed grants and subsidies |
- |
-54.0 |
-481.0 |
-514.0 |
-536.0 |
-557.0 |
-580.0 |
-604.0 |
-628.0 |
-654.0 |
-681.0 |
-1,049.0 |
-5,289.0 |
|
Indexed other administered programs |
- |
-1,490.0 |
-4,250.0 |
-4,500.0 |
-4,740.0 |
-4,950.0 |
-5,300.0 |
-5,520.0 |
-5,740.0 |
-6,010.0 |
-6,230.0 |
-10,240.0 |
-48,730.0 |
|
Departmental |
|
|
|
|
|
|
|
|
|
|
|
|
|
|
Services Australia |
- |
-5.0 |
- |
- |
- |
- |
- |
- |
- |
- |
- |
-5.0 |
-5.0 |
|
Australian Taxation Office |
- |
-2.0 |
-2.4 |
-2.7 |
-3.6 |
-4.3 |
-5.0 |
-5.3 |
-5.0 |
-5.1 |
-5.3 |
-7.1 |
-40.7 |
|
Total – payments |
- |
-55,551.0 |
-61,933.4 |
-65,216.7 |
-68,579.6 |
-71,911.3 |
-75,485.0 |
-79,129.3 |
-82,773.0 |
-86,669.1 |
-90,716.3 |
-182,701.1 |
-737,964.7 |
|
Total (excluding PDI) |
- |
-1,211.0 |
-3,873.4 |
-4,116.7 |
-4,339.6 |
-4,551.3 |
-4,895.0 |
-5,109.3 |
-5,323.0 |
-5,569.1 |
-5,796.3 |
-9,201.1 |
-44,784.7 |
(a) A positive number for the underlying cash balance indicates an increase in receipts or a decrease in payments or net capital investment in cash terms. A negative number for the underlying cash balance indicates a decrease in receipts or an increase in payments or net capital investment in cash terms.
(b) Financial implications were rounded consistent with the PBO’s rounding rules.13
- Indicates nil.
Table A3: Increasing the GST rate – Memorandum item: Public Debt Interest (PDI) impacts – Fiscal and underlying cash balances(a)(b)(c)
|
|
2026-27 |
2027-28 |
2028-29 |
2029-30 |
2030-31 |
2031-32 |
2032-33 |
2033-34 |
2034-35 |
2035-36 |
2036-37 |
Total to |
Total to |
|
Fiscal balance |
- |
-30.0 |
-150.0 |
-360.0 |
-580.0 |
-810.0 |
-1,060.0 |
-1,340.0 |
-1,640.0 |
-1,970.0 |
-2,310.0 |
-540.0 |
-10,250.0 |
|
Underlying cash balance |
- |
-20.0 |
-120.0 |
-300.0 |
-510.0 |
-740.0 |
-990.0 |
-1,260.0 |
-1,560.0 |
-1,870.0 |
-2,220.0 |
-440.0 |
-9,590.0 |
(a) As this table is presented as a memorandum item, these figures are not reflected in the totals in the tables above. This is consistent with the approach taken in the budget where the budget impact of most measures is presented excluding the impact on PDI. If the reader would like a complete picture of the total aggregate, then these figures would need to be added to the figures above. For further information on government borrowing and financing please refer to the PBO’s online budget glossary.14
(b) A positive number for the fiscal balance indicates an increase in revenue or a decrease in expenses or net capital investment in accrual terms. A negative number for the fiscal balance indicates a decrease in revenue or an increase in expenses or net capital investment in accrual terms. A positive number for the underlying cash balance indicates an increase in receipts or a decrease in payments or net capital investment in cash terms. A negative number for the underlying cash balance indicates a decrease in receipts or an increase in payments or net capital investment in cash terms.15
(c) Financial implications were rounded consistent with the PBO’s rounding rules.
- Indicates nil.
Attachment B – Fiscal balance impacts
The fiscal balance amounts are lower than the impact on the underlying cash balance because of how government revenue is recognised on an accrual basis compared to a cash basis. On an accrual basis, GST is recognised as tax revenue when businesses report the amounts on their Business Activity Statements (BAS). However, businesses may pay the cash amounts at a later date, or the amounts may never be paid and later written off by the ATO.16
The fiscal balance includes all tax revenue, regardless of when (or if) it is eventually paid. The revenue component of the costing is therefore higher on an accrual basis than on a cash basis. Conversely, the expense for remitting the GST to the states is nearly identical on the accrual and cash bases. This means the net impact is smaller on an accrual basis than on a cash basis.
[1] More information on historical trends in GST revenue, including demographic impacts, can be found in the PBO’s report,
Structural trends in GST.
[2] The PBO’s report Australia's Tax Mix discusses the efficiency and equity of different taxes in further detail.
[3] This analysis assumes that additional GST revenue received is used to reduce debt. In practice, governments may instead choose to use some or all of the additional revenue to fund new or expanded spending, which would result in different debt outcomes.
[4] State gross debt figures do not include impacts to PDI. If PDI impacts were included state gross debt would decrease further due to the decrease to interest payments from lower total debt.
[5] PDI impacts are not included in state totals and are included in Commonwealth gross debt totals. State and territory figures are based on their respective 2026-27 budget updates, except for the Australian Capital Territory, New South Wales, Queensland and South Australia. For states and territories that have not released a 2026-27 budget update as at 30 May 2026, figures are based on their respective 2025-26 mid-year budget updates.
[6] This is a simplification. Payments like the Age Pension, Disability Support Pension and other income support payments are indexed to the higher of CPI and the Pensioner and Beneficiary Living Cost Index (PBLCI), with some payments also benchmarked. The PBO has assumed in this analysis that CPI would be the chosen indexation for these programs.
[7] Income quintiles are based on equivalised household disposable income, which includes all income sources after tax (including Medicare levy and Medicare levy surcharge) is deducted and are adjusted to account for differences in size and composition of households. Income quintiles do not capture household assets. In 2021-22 the average gross disposable income for households in the lowest income quintile was $54,134, the second income quintile was $86,689, the third income quintile was $117,495, the fourth income quintile was $154,434 and the highest income quintile was $288,311.
[8] Income is total gross disposable income between 2027-28 and 2036-37, with income each year grown by the change in average weekly ordinary time earnings.
[9] Preliminary assessment of the impact of The New Tax System, Treasury Economic Roundup (2003).
[10] See Historical Budget Forecasts (Table 5) for a detailed list of the budget’s historical economic forecasts.
[11] The version used internally for this costing has been adjusted to produce more comprehensive results, and any figures generated using the version currently on the PBO’s website may not be the same.
[12] www.pbo.gov.au/for-parliamentarians/how-we-analyse/pbo-rounding-rules
[13] www.pbo.gov.au/for-parliamentarians/how-we-analyse/pbo-rounding-rules
[14] www.pbo.gov.au/about-budgets/online-budget-glossary
[15] www.pbo.gov.au/for-parliamentarians/how-we-analyse/pbo-rounding-rules
[16] According to the ATO’s Goods and services tax gap, the latest estimate of the overall net GST gap is $8.7 billion in 2023 24, or 9.4% of theoretical total GST. Tax gaps estimate the difference between what the ATO expects to collect and the amount that would have been collected if every taxpayer was fully compliant with relevant taxation law.