Summary of policy specification
Increase defence spending progressively over 10 years to be 1% of Gross Domestic Product (GDP) higher in 2036-37 than currently projected.
Policy start date: 1 July 2027 | Budget baseline: 2026-27 Budget | Policy topic: Defence
Summary of policy impact
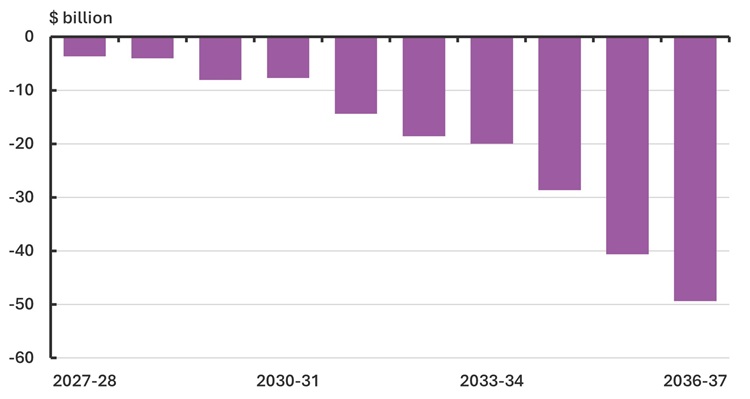
Increasing defence spending to reach 3.4% of GDP in 2036-37 (1% of GDP higher than currently projected), would worsen the underlying cash balance (UCB) by around $15.7 billion over the forward estimates and $195 billion over the medium term (Figure 1).
The PBO has assumed that defence spending as a proportion of GDP would cumulatively increase by around 0.14% of GDP annually from 1 July 2027 to 30 June 2037. Given the target is 1% higher at the end of the medium term and phased in, the fiscal impact is highly subject to the rate at which spending is increased annually to achieve the 1% increase at the end of the period.
Figure 1: Change in underlying cash balance across the medium term
Policy context
The Australian Government provides funding to the Department of Defence, the Australian Signals Directorate (ASD), the Australian Submarine Agency (ASA) and the Australian Naval Nuclear Power Safety Regulator (ANNPSR) for both military and supporting civilian purposes. The combined funding of these agencies is the subject of this costing and is the same basis as what is typically reported in documents such as the National Defence Strategy. The funding does not include flow on costs such as veterans’ healthcare or housing through the Department of Veterans’ Affairs or Defence Housing Australia.
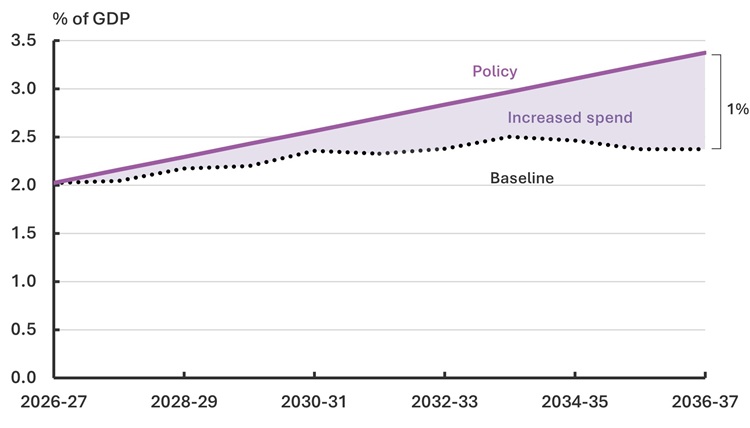
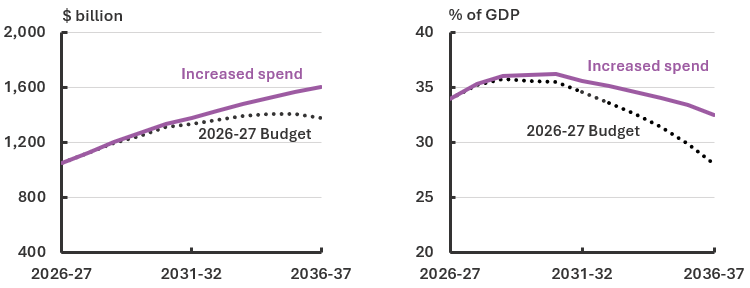
Defence funding is not currently fixed as a share of GDP and has fluctuated over time, reflecting economic conditions, government funding decisions, and the timing of major capital projects. As of the 2026-27 Budget, total funding is expected to be approximately 2% of GDP in 2026-27, increasing to 2.4% of GDP by 2036-37 (shown in Figure 2 below). This costing shows the effect of phasing to 1% of GDP above the current projected 2036-37 level (that is, 3.4% of GDP) and assumes a steady increase to this new target. The difference between the baseline funding profile and the new profile reflects the cost of the policy.
Figure 2: Defence funding
Defence spending comprises a mix of personnel costs, operating and sustainment expenditure, and capital investment, including the acquisition of major military capabilities such as weapons and military aircraft, ships and submarines. Capital spending is often subject to long lead times and delivery risks, while personnel and sustainment costs tend to grow more steadily over time.
An increase of 1% of GDP above baseline has been used as a simple example. Other rates can also be considered using the PBO’s Build your own Budget (BYOB) tool but the results will largely be proportional. That is, an increase of 2% of GDP with the same growth profile will cost around twice the amount in this analysis, and an increase of 0.5% of GDP will cost around half.
Fiscal impact overview
Increasing defence spending by 1% of GDP above the 2026-27 Budget baseline estimates would worsen the fiscal position. The policy would decrease the fiscal and underlying cash balances by around $15.7 billion over the 2026-27 Budget forward estimates period and around $195 billion over the medium term to 2036-37 (Figure 3). The projected return to surplus would accordingly be delayed by 2 years from 2034-35 to 2036-37.
Consistent with standard PBO costing practice, this analysis assumes that all other policy settings remain unchanged. Higher defence spending adds to the amount government must borrow, increasing debt and resulting public debt interest payments over time.
The policy would increase government debt by $16.5 billion by the end of the forward estimates and $221 billion by the end of the medium term (Figure 4).
Figure 3: Underlying cash balance, amount and share of GDP
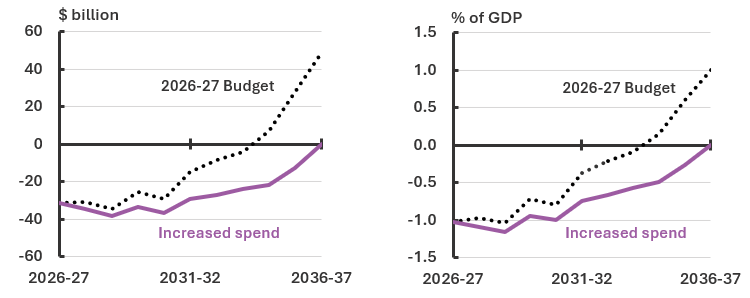
Figure 4: Gross government debt, amount and share of GDP
Sensitivity analysis
The financial implications of the policy are sensitive to baseline defence funding and GDP.
The modelled increase in funding under the policy assumes that there is immediate and sufficient demand for spending, and that the affected agencies can evenly ramp up spending in line with this funding profile. Acquiring hardware or increasing staffing can involve a significant lead time, particularly for activities such as design or tender processes, and operational costs are naturally tied to these assets. As such, in practice, except for ‘shovel-ready projects’ that are prepared and lacking only funding, increasing cash outlays may involve a lag.
Different assumptions about the trajectory of spending increases would result in significantly different estimates of financial impact. For instance, a slower start initially and then later sharper increase in defence spending could also achieve the 1.0% of GDP increase in the specified timeframes, but this would have a lower impact across the medium term than the trajectory modelled in this analysis.
Should nominal GDP turn out higher (lower) than that assumed in this analysis, the cost of the policy would also be higher (lower).
Table 1 shows a sensitivity analysis with different funding targets for 2036-37 using the same approach, the additional funding provided due to the policy, and total funding over the period.
Table 1: Defence funding with various share of GDP targets, 2026-27 to 2036-37
|
2036-37 target |
Additional funding |
Total defence funding |
|
3.0% |
106.4 |
1,103.0 |
|
3.5% |
224.5 |
1,221.1 |
|
4.0% |
342.5 |
1,339.1 |
|
4.5% |
460.6 |
1,457.2 |
|
5.0% |
578.7 |
1,575.3 |
Our approach
Assumptions
The PBO has made the following assumptions in this analysis.
- The baseline spending would be as per estimates from the Department of Defence to 2035-36, with 2036-37 estimated by assuming spending as a proportion of GDP would be held constant.
- Under the policy, defence spending as a proportion of GDP would cumulatively increase by around 0.14% of GDP annually from 1 July 2027 to 30 June 2037.
- There would be no flow-on impacts to agencies outside of the Department of Defence, ASD, ASA and ANNPSR from increased defence spending. Defence would be able to absorb the increase with no funds allocated to a given year left unspent.
Methodology
The required level of spending in dollar terms in the target year was calculated by multiplying the specified share of GDP by projected nominal GDP.
Defence spending under the policy was modelled as per the assumptions above, increasing from approximately 2.0% of GDP at the start date to the spending level of 3.4% of GDP in the target year. Financial implications were calculated by subtracting the baseline spending profile from the modelled profile.
This costing includes first round (static) fiscal impacts – reflecting the immediate budgetary effect of the policy. Consistent with the Charter of Budget Honesty and standard PBO costing practice, it does not incorporate broader second round economic effects, such as feedback into GDP, employment or wages, which could materially alter budget outcomes.
Data Sources
The Department of Defence provided the profile of consolidated defence funding to 2035-36 as at the 2026-27 Budget.
Commonwealth of Australia (2026) 2026-27 Budget, Commonwealth of Australia.
Department of Defence (2026) Portfolio Budget Statements 2026-27: Budget Related Paper No. 1.4A: Defence Portfolio, Australian Government.
How can I test other policies?
The PBO’s Build your own Budget (BYOB) is an educational interactive tool that allows you to explore the impact of different economic assumptions and policy settings of your choice.
Attachment A – Increase defence spending – Financial implications
Table A1: Increase defence spending – Fiscal and underlying cash balances(a)(b)
|
|
2026-27 |
2027-28 |
2028-29 |
2029-30 |
2030-31 |
2031-32 |
2032-33 |
2033-34 |
2034-35 |
2035-36 |
2036-37 |
Total to |
Total to |
|
Expenses |
|
|
|
|
|
|
|
|
|
|
|
|
|
|
Defence |
- |
-3,600.0 |
-4,000.0 |
-8,100.0 |
-7,700.0 |
-14,400.0 |
-18,600.0 |
-19,900.0 |
-28,600.0 |
-40,600.0 |
-49,300.0 |
-15,700.0 |
-194,800.0 |
|
Total (excluding PDI) |
- |
-3,600.0 |
-4,000.0 |
-8,100.0 |
-7,700.0 |
-14,400.0 |
-18,600.0 |
-19,900.0 |
-28,600.0 |
-40,600.0 |
-49,300.0 |
-15,700.0 |
-194,800.0 |
(a) A positive number for the fiscal balance indicates an increase in revenue or a decrease in expenses or net capital investment in accrual terms. A negative number for the fiscal balance indicates a decrease in revenue or an increase in expenses or net capital investment in accrual terms. A positive number for the underlying cash balance indicates an increase in receipts or a decrease in payments or net capital investment in cash terms. A negative number for the underlying cash balance indicates a decrease in receipts or an increase in payments or net capital investment in cash terms.
(b) Financial implications were rounded consistent with the PBO’s rounding rules.1
- Indicates nil.
Table A2: Increase defence spending – Memorandum item: Public Debt Interest (PDI) impacts – Fiscal and underlying cash balances(a)(b)(c)
|
|
2026-27 |
2027-28 |
2028-29 |
2029-30 |
2030-31 |
2031-32 |
2032-33 |
2033-34 |
2034-35 |
2035-36 |
2036-37 |
Total to |
Total to |
|
Fiscal balance |
- |
-90.0 |
-280.0 |
-590.0 |
-990.0 |
-1,540.0 |
-2,380.0 |
-3,370.0 |
-4,640.0 |
-6,430.0 |
-8,770.0 |
-960.0 |
-29,080.0 |
|
Underlying cash balance |
- |
-60.0 |
-220.0 |
-500.0 |
-880.0 |
-1,390.0 |
-2,140.0 |
-3,090.0 |
-4,280.0 |
-5,920.0 |
-8,110.0 |
-780.0 |
-26,590.0 |
(a) As this table is presented as a memorandum item, these figures are not reflected in the totals in the table above. This is consistent with the approach taken in the budget where the budget impact of most measures is presented excluding the impact on PDI. If the reader would like a complete picture of the total aggregate, then these figures would need to be added to the figures above. For further information on government borrowing and financing please refer to the PBO’s online budget glossary.2
(b) A positive number for the fiscal balance indicates an increase in revenue or a decrease in expenses or net capital investment in accrual terms. A negative number for the fiscal balance indicates a decrease in revenue or an increase in expenses or net capital investment in accrual terms. A positive number for the underlying cash balance indicates an increase in receipts or a decrease in payments or net capital investment in cash terms. A negative number for the underlying cash balance indicates a decrease in receipts or an increase in payments or net capital investment in cash terms.
(c) Financial implications were rounded consistent with the PBO’s rounding rules.3
- Indicates nil.
Attachment B – Reporting as a share of national economic product (GDP)
Internationally, there are a range of different definitions of defence resourcing. Most international comparisons will typically reference spending as a share of output (GDP), however what is captured in spending will differ between jurisdictions and measures.
Historically, the Australian Government has presented the estimated funding as a share of GDP using consolidated defence funding as the numerator, so the ‘main’ dollar figure and the figure used for share of output calculations was the same.
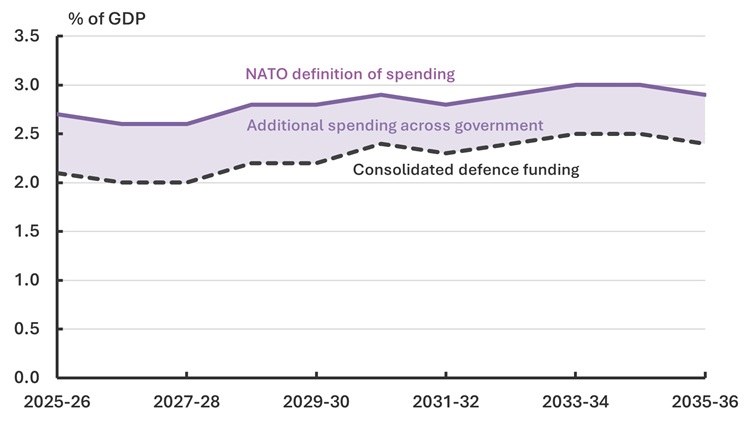
The Australian Government has also reported defence spending as share of GDP on the basis used by the North Atlantic Treaty Organisation (NATO). In principle, NATO captures direct military spending plus veterans’ pensions, intelligence, and certain infrastructure projects. Estimates of Australian spending under the NATO measure, based on Australian consolidated defence funding plus eligible spending elsewhere in Government, are included in Figure 5.
Figure 5: Defence spending as a share of output