14 July 2026
Overview
The 2026-27 Medium-Term Budget Outlook (MTBO) presents the 11th edition of the Parliamentary Budget Office’s (PBO’s) independent projections for Commonwealth budget sustainability across the medium term. It also updates the PBO’s analysis of long-term fiscal sustainability to 2069-70.
Budget outlook projected to improve
The PBO’s medium-term projections suggest an improved fiscal position over the coming decade.
In comparison to last year’s projections, the improved position is notable, particularly given the global outlook. These improvements partly reflect higher oil prices linked to the Middle East conflict in the forward estimates, and policy decisions affecting the National Disability Insurance Scheme (NDIS) and tax policy in the medium term. These gains are partially offset by increased pressures in major spending items, particularly interest costs, defence and hospitals.
Australia’s share of debt to GDP remains low relative to comparable economies. However, its upward trend over the past two decades – particularly taking into account state as well as Commonwealth debt – should be monitored. While projections for debt are lower than in the PBO’s previous reports, interest payments have continued to be one of the fastest growing areas of spending.
Revenue: continues to be reliant on personal income taxes while tobacco excise withers
The projected tax mix continues to shift towards personal income taxes mostly driven by bracket creep, with a smaller contribution from measures announced in the 2026-27 Budget. Should the government provide future personal income tax cuts similar to those of the past absent other policy changes, a return to surplus would become unlikely over the medium term. This holds, even if other economic factors, such as commodity prices, turn out considerably better than assumed. Excise revenues are expected to continue to decline as a share of GDP. There is particularly high uncertainty around the sustainability of future fuel and tobacco excise collections.
Projections also include a historically large allowance for revenue ‘decisions taken but not yet announced’, adding uncertainty to the source and extent of forecast revenue improvements.
Expenditure: structural pressures dominate
While expenses are assumed to ease slightly as a share of GDP, this relies heavily on projected savings – particularly around the historically large NDIS savings announced in 2026-27 Budget. These are largely offset by faster growth in structural spending including interest costs, defence and health.
Climate change has and will continue to have broad impacts on the Australian economy, which in turn create fiscal risks. Climate change represents a fiscal risk through direct costs (including the cost of responding to disasters); indirect economic impacts (such as lower revenue from lower labour productivity); and mitigation and adaptation expenditure.
Long-term outlook: sustainable, but risks remain
Over the long term, the fiscal position remains sustainable, but growing economic and fiscal pressures create uncertainty. Structural economic headwinds – including weaker productivity and demographic change – could place upward pressure on debt relative to historical experience. Rising budget pressures (interest payments, defence and health) and increasing reliance on personal income taxes suggest budget balances face risks over time.
Together, these factors point to less favourable long-term fiscal outcomes in future than those seen historically.
Check out the updated Build your own budget interactive analysis tool for a more comprehensive view of overall impacts.
The interactive analysis tool allows users to test various policy and parameter changes to see the impact on the Australian Government budget.
The modelling in Build your own budget underpins the projections and analysis contained in this report and users can replicate the scenario analysis contained in this report for a more comprehensive view of overall impacts.
Use our online budget glossary for explanations of the terms used in this publication.
1 Fiscal projections
- Compared to last year’s report, projections for the fiscal outlook have improved. This is driven by higher forecast commodity prices in the forward estimates period and government policy decisions in the medium term, such as the National Disability Insurance Scheme (NDIS) and taxation changes.
- The underlying cash balance (UCB) is projected to improve from a deficit of 1.0% of GDP in 2026-27 to surpluses from 2034-35.
- This projected fiscal consolidation over the next decade is driven by increasing personal income taxes (mainly bracket creep) and expenses falling as a share of GDP.
- Gross debt is projected to fall from 34.0% of GDP in 2026-27 to 28.3% of GDP in 2036-37. Public debt interest payments ease towards the end of the medium term.
- While debt to GDP remains low relative to comparable economies, its upward trend over the past two decades should be monitored.
- All commonly used measures of the budget balance are projected to improve into surplus over the medium term.
Across the projection period, the UCB is projected to improve modestly over the forward estimates (to 2029-30), then more substantially over the medium term (to 2036-37). The improvement primarily reflects higher personal income tax receipts (mainly from bracket creep), together with lower public service spending and non-hospital funding to the states. These effects are partly offset by lower excise revenue and higher major payments such as on interest, defence and hospitals. Consistent with the 2026-27 Budget, these projections assume no further personal income tax cuts for the next decade beyond what has already been announced.
Figure 1-1: Underlying cash balance, 2006-07 to 2036-37
Source: 2025-26 Budget, 2026-27 Budget and PBO analysis.
Note: 2025-26 projections refer to the PBO’s previous Medium-Term Budget Outlook report.
Compared to last year’s projections, presented in the 2025-26 Medium-Term Budget Outlook (MTBO), the fiscal outlook is improved. The previous report projected deficits across the medium term, while a return to surplus is now projected in 2034-35 (Figure 1-1). In the forward estimates, the improvement is partly driven by the revenue from higher-than-expected commodity prices. In the medium term, the improvement is largely due to lower projected NDIS expenditure as a result of greater eligibility restrictions, and increases in projected tax receipts from changes to negative gearing, capital gains tax and trusts announced in the 2026-27 Budget.
The Government’s fiscal strategy was updated in the 2026-27 Budget to include a greater focus on sustainability including:
- ‘Working to put downward pressure on payments-to-GDP, including by taking action on structural fiscal pressures’
- ‘Finding savings and reprioritisations to strengthen the budget over time’
- a new objective to ‘lower the tax burden on working Australians over time’.
Box 1: About the 2026-27 MTBO
The PBO’s legislation requires use of the latest economic assumptions, policy settings and fiscal forecasts which were presented in the Australian Government's 2026-27 Budget, published on 12 May 2026. Accordingly, the fiscal estimates shown in MTBO for the 4 year ‘forward estimates’ period, 2026-27 to 2029-30, are identical to the budget. The PBO’s independently modelled fiscal projections are for the ‘medium term’, which refers to the period from 2030-31 to 2036-37 (reaching out to a decade from the budget year). The PBO’s projections are based on the same economic assumptions and policy settings that underpin the budget.
For more information about the budget and access to PBO tools, such as the PBO’s interactive Build your own budget tool.
Despite the current conflict in the Middle East, Australia’s fiscal outlook remains stable, with debt as a share of GDP projected to peak at 35.8% of GDP in 2028-29 and then decline over the medium term, as a result of the steady improvement in the UCB over the decade.
Compared to the 2025-26 MTBO, the projection for gross debt as a share of GDP (Figure 1-2) is slightly more favourable over both the forward estimates and the medium term. This reflects the upward revisions to the UCB projections.
Figure 1-2: Gross debt, 1996-97 to 2036-37
Source: 2025-26 Budget, 2026-27 Budget and PBO analysis.
While Australia’s share of debt to GDP remains low relative to comparable economies,1 its upward trend over the past two decades highlights a gradual deterioration in the fiscal position, reinforcing the importance of maintaining settings that stabilise debt over the medium term.
Gross interest payments (Figure 1-3) are projected to rise over the forward estimates and into the early medium term, peaking at 1.5% of GDP in 2032‑33 before declining, reflecting the level of the debt stock. Previously accumulated deficits mean interest expenses are one of the fastest‑growing areas of spending, highlighting the increasing budgetary cost of servicing debt. While borrowing can play an important role in supporting economic stability and productivity‑enhancing investment, it still entails ongoing servicing costs that weigh on the budget.
Compared to the 2025‑26 MTBO, projections for interest expenses are largely unchanged over the forward estimates, before becoming modestly lower over the medium term due to a reduced debt trajectory.
10‑year government bond yields have increased and are projected to remain between 4.8% and 4.9% over the medium term reflecting stronger economic conditions.2 Bond yields have also been trending higher globally.3 Continued increases in bond yields since COVID-19 initially reflected the post‑pandemic recovery and have since been driven higher by global inflationary pressures due to the ongoing conflict in the Middle East. These higher rates significantly raise the cost of servicing both new and refinanced debt.
Figure 1-3: Gross interest payments, 1996-97 to 2036-37
Source: 2025-26 Budget, 2026-27 Budget and PBO analysis.
Note: Interest paid consists of all cash interest payments of the general government sector, lease and other non-lease liabilities.
The primary underlying cash balance is the UCB excluding public debt interest (PDI) payments and interest receipts. By excluding the interest payments arising from past deficits and debt accrual, it provides an informative measure of the government’s current fiscal stance.
The primary UCB is projected to return to surplus within the forward estimates period in 2029-30 (Figure 1-4), which means the government’s ongoing operations would not contribute to debt beyond this point.
Figure 1-4: Primary underlying cash balance and underlying cash balance, 2021-22 to 2036
Source: 2026-27 Budget and PBO analysis.
The headline cash balance (HCB) is similar to the UCB, but it also accounts for the government’s investment in financial assets for policy purposes (such as student loans and equity investments).4 These ‘alternative financing’ mechanisms are sometimes called ‘off-budget’, but they are part of the HCB.5
In 2026-27, the HCB deficit is around double the UCB deficit (Figure 1-5). Both balances then improve over the medium term, but a ‘wedge’ remains between the HCB and UCB, largely reflecting ongoing alternative financing arrangements. This gap is projected to narrow before stabilising from 2032-33.
Figure 1-5: Underlying cash balance and headline cash balance, 2021-22 to 2036-37
Source: 2026-27 Budget and PBO analysis.
Alternative financing in the budget
Alternative financing arrangements take many forms such as equity investments, loans or guarantees. Typically, these arrangements involve the exchange of one asset (cash) for another asset (or liability) with the associated cash flows mostly not affecting the government’s overall balance sheet position.6 These transactions are called ‘net cash flows from investments in financial assets for policy purposes’,7 which form the difference between the HCB and the UCB.
The 2026-27 Budget uses alternative financing for several new measures. For example, the Energy Sovereignty – Fuel Security and Resilience measure which responds to the emerging fuel supply disruptions, establishes the Fuel and Fertiliser Security Facility with an exposure cap of up to $7.5 billion to boost supply and storage.8 It also provides $1 billion in interest free loans to affected businesses through the Economic Resilience Program, drawing funds from the National Reconstruction Fund. Elsewhere, the Budget also includes equity injections to Australian Naval Infrastructure and Airservices Australia.9
The PBO’s report Alternative financing of government policies provides more information.
2 Fiscal uncertainties and risks
- Economic shocks and structural economic changes will influence the fiscal outlook.
- Future policy decisions, particularly personal income tax cuts, could materially change the fiscal outlook, depending on their magnitude.
- Migration is assumed flat, but higher or lower levels would have large fiscal impacts.
- Costs associated with climate change and climate change policy present a growing but uncertain risk to fiscal projections.
- The recent growth in total state net debt presents an additional and emerging fiscal risk, with state debt trajectories increasing at a faster rate than Commonwealth debt.
Economic shocks, especially global shocks, can have major implications for both economic and fiscal projections. Over the past 20 years, the Global Financial Crisis and the COVID-19 pandemic each had substantial effects on the fiscal position. Most of current Australian Government debt stock was generated by responding to these globally significant negative events. More recently, conflicts in Ukraine and the Middle East have also affected Australia, particularly through reductions in the global supply of goods which increases their prices.
The conflict in the Middle East represents a key source of uncertainty for the economy, primarily through its impact on global energy markets.
Australia imports most of the refined fuels it consumes, but exports most of its petroleum products, such as crude oil and natural gas. This means that while households and businesses are exposed to higher fuel prices, the budget will improve with higher export prices and increased nominal GDP. A prolonged conflict would be likely to detract more from economic growth and tax receipts, further offsetting the improvement from oil prices.
Box 2 considers the fiscal impacts of the conflict, including potential fiscal implications should it persist.
Box 2: Fiscal impacts of oil price increases associated with the Middle East conflict
The 2026–27 Budget includes scenario analysis illustrating the potential economic impacts of a more prolonged disruption to energy markets over the forward estimates. Higher oil prices and inflation have a direct impact on the budget through:
- higher revenue, particularly additional company tax from petroleum products, will improve the budget position
- higher expenditure, such as social security payments indexed to inflation, will worsen the budget position
- policy responses, including targeted support measures that reduce revenue, such as reducing the rate of fuel excise, or increase expenditure, will also worsen the budget position.
If these conditions were to persist, the fiscal impacts would be expected to continue but may be moderated or offset by slower economic growth.
Consistent with the government’s budget, the PBO’s fiscal projections are based on a ‘no policy change’ assumption which includes no personal income tax cuts for the next decade beyond those already legislated, as well as temporary programs due to terminate not being extended, including grants and departmental expenditure.
Historically, these assumptions have not been realised, with governments typically announcing further tax cuts as well as additional expenditure associated with new or extended programs. Figure 2-1 shows the impact on the budget under 3 scenarios:
- Return bracket creep - indexing the tax thresholds by CPI each year.
- Maintain grants - reflecting historic revisions, government grants to states and territories for road and rail funding are 0.25% of GDP higher than baseline projections from 2030-31 and beyond, with smaller increases for earlier years.
- Maintain the size of the public service – reflecting historic revisions, government operating costs are 0.5% of GDP higher than the PBO’s baseline projections from 2029-30 and beyond, with smaller increases for earlier years.
- Public service staffing projections are discussed further in Section 5.4.
Figure 2-1: Underlying cash balance under different scenarios, 2024-25 to 2036-37
Source: 2026-27 Budget and PBO’s Build your own budget tool.
The results highlight that policy changes that provide personal income tax or keep grant programs at historical levels can have a material impact on the fiscal outlook. Indexing the tax thresholds – either alone or in combination with higher spending outcomes – leads to a persistent deterioration in the budget position relative to the baseline in the absence of offsetting expenditure or revenue measures.
Under these alternative paths, the budget is unlikely to return to surplus over the medium term, illustrating the sensitivity of the fiscal outlook to both revenue policy choices and expenditure outcomes.
Net overseas migration (NOM) is a key driver of fiscal outcomes, affecting revenue and expenditure.10
On average, migrants typically have a more positive fiscal impact than members of the total population. Although migrants include a similar proportion of school-aged people as the broader population, they are less represented in older age groups and generally arrive after many publicly funded education and early health care costs have already been incurred overseas (Figure 2-2).
Governments have also sought to use migration in a range of ways that affect the fiscal position over the medium to long term. These include addressing structural demographic pressures associated with an ageing population, supporting labour force growth and skills needs, and contributing to productivity and economic activity.
This report reflects the fiscal impacts of migration (NOM) to the Commonwealth budget. There are also a range of direct and indirect effects which could result in positive and negative fiscal impacts for states and territories. Some of these state budget effects include changes in demand for health, education, housing and infrastructure services, along with impacts on GST distributions, Commonwealth grants and state tax revenues.
Figure 2-2: Age distribution of the Australian population and migrant cohort in 2024-25
Source: Australian Bureau of Statistics (2024-25), Overseas Migration, ABS website and PBO analysis.
Notably, NOM is influenced by various factors affecting both arrivals and departures, many of which are beyond the direct control of government. For example, departures and duration of stay tend to be shaped by individual behaviour, alongside economic and global conditions. Although arrivals are more directly influenced by government policy settings, such as visa conditions and caps, they also include uncapped, demand driven flows, such as certain temporary visa holders, and the unrestricted movement of New Zealand and Australian citizens.11
While NOM is expected to decline and stabilise from its 2022-23 peak, departure rates remain a key source of uncertainty.12 Since the COVID 19 pandemic, departure rates have been lower than forecast, contributing to upward revisions to NOM forecasts.13 Some uncertainty remains, as there is a risk of people who arrived after the borders reopened having shorter-than-expected stays in Australia which increases departures, reducing NOM if arrivals remain unchanged. Reflecting the recent trends, departure rates may also continue to be lower as migrants stay longer, which would translate into higher NOM.
To assess the sensitivity of the budget to changes in NOM, we model debt to GDP and the UCB impacts under alternative scenarios (Table 2-1). The baseline scenario is based on national population projections from the Centre for Population.
Table 2-1: Net overseas migration scenarios
|
Scenarios |
Thousands |
||||||||||
|
|
2026-27 |
2027-28 |
2028-29 |
2029-30 |
2030-31 |
2031-32 |
2032-33 |
2033-34 |
2034-35 |
2035-36 |
2036-37 |
|
Much Higher (+80,000) |
325.0 |
305.0 |
305.0 |
305.0 |
315.0 |
315.0 |
315.0 |
315.0 |
315.0 |
315.0 |
315.0 |
|
Higher (+40,000) |
285.0 |
265.0 |
265.0 |
265.0 |
275.0 |
275.0 |
275.0 |
275.0 |
275.0 |
275.0 |
275.0 |
|
Baseline |
245.0 |
225.0 |
225.0 |
225.0 |
235.0 |
235.0 |
235.0 |
235.0 |
235.0 |
235.0 |
235.0 |
|
Lower |
205.0 |
185.0 |
185.0 |
185.0 |
195.0 |
195.0 |
195.0 |
195.0 |
195.0 |
195.0 |
195.0 |
|
Much Lower (‑80,000) |
165.0 |
145.0 |
145.0 |
145.0 |
155.0 |
155.0 |
155.0 |
155.0 |
155.0 |
155.0 |
155.0 |
Source: Centre for Population 2026, Net overseas migration forecasts in the 2026-27 Budget and PBO analysis.
Figure 2-3 shows the results of the above 5 scenarios (Table 2-1). Debt-to-GDP is expected to decline in all of the PBO’s scenarios by the end of the medium term. The ‘Much Higher’ (+80,000 per year) scenario shows that the debt-to-GDP decreases to around 24.5% by 2036-37, compared to around 32.3% in the ‘Much Lower’ scenario. This trend shows the fiscal improvements to the budget of higher net migration into Australia.
Figure 2-3: Net overseas migration – Debt-to-GDP, 2024-25 to 2036-37
Source: 2026-27 Budget and PBO’s Build your own budget tool.
Under the scenario of ‘Higher’ NOM (+40,000 migrants), the UCB is estimated to improve by around $80.6 billion over the medium term, while under a scenario of ‘Lower’ NOM (-40,000 migrants) results in a deterioration of around $79.1 billion (Figure 2-4).
The improvement under a higher NOM is primarily driven by higher tax receipts, particularly personal income taxes. Migration also supports company tax, superannuation fund taxes and other tax streams, as well as fees, charges and broader economic activity.
While higher NOM also increases expenses, the aggregate impact is less than the revenue gain. The largest increase is in grants, mainly to the states and territories, such as general revenue assistance and school funding. Population growth affects the distribution of some Commonwealth payments, including GST revenue, and increases demand for services and infrastructure delivered by states and territories.14
The aggregate estimated impact on the budget of the various scenarios is shown in Figure 2-4.
Figure 2-4: Net overseas migration scenarios – Underlying cash balance, 2024-25 to 2036-37
Source: 2026-27 Budget and PBO’s Build your own budget tool.
Climate change, and the response to it, has and will continue to have broad impacts on the Australian economy. Natural disasters and their associated damages are becoming more severe and more frequent. Changing climatic conditions pose growing risks to infrastructure, health and economic activity.15 However, investments to mitigate the impacts and adapt to the changing conditions, although increasing expenditure, may reduce damages and prevent costs.
This section looks at the sensitivity of the fiscal outlook to climate-related effects and policies over the medium term. The PBO does not model the economic and fiscal impacts of climate change, but we have constructed scenarios based on public information on the range of possible impacts.
While their nature and severity are uncertain, the fiscal impacts of climate change can be helpfully grouped into three categories: direct costs, indirect economic impacts, and mitigation and adaptation expenditure.
Direct costs refer to expenditure arising from climate-related events and physical damages from longer-term environmental changes.
Disaster response expenditure is a key cost in this category, with the majority of Commonwealth costs incurred through the Disaster Recovery Funding Arrangements (DRFA) and Australian Government Disaster Recovery Payment (AGDRP).16 This expenditure fluctuates significantly year-to-year and due to this uncertainty, future funding requirements are not provisioned for in budget forecasts.
Indirect economic impacts capture the broader impacts of climate change on economic activity, such as those on labour productivity, with flow-on effects to government revenue, as well as those on individuals and communities with flow-on effects for government expenditure through healthcare, social security and other channels.
The relevant literature assessing the impact of global warming levels on GDP, presents a wide range of estimates due to differences in data sourcing, assumptions and empirical approaches. As an example, from across a selection of studies assessing the future economic impact of global warming between 2.5°C and 3.0°C above pre-industrial levels, the average estimated decrease in GDP was around 1.5%, with the largest estimated decreases in GDP being 20%.17
Mitigation and adaptation expenditure relates to proactive policy-driven expenditure in the face of climate change-related pressures or economic opportunities. This stands in contrast to the ‘direct costs’ which are reactive as they occur in response to a disaster or adverse event.
The first component, mitigation, covers efforts to limit greenhouse gas emissions and, more broadly, shift Australia’s economy towards being more sustainable. Australia has made binding commitments such as the 2015 Paris Agreement and domestically legislated targets to achieve ‘net zero’ by 2050.18 Achieving these targets will require substantial changes across the Australian economy supported by government.
An example of mitigation expenditure is the Future Made in Australia policy package from the 2024-25 Budget, which committed funding to support the development of industries associated with the net zero transition, including green metals, low carbon liquid fuels and clean energy manufacturing.19
The second component, adaptation, covers efforts to anticipate adverse effects of climate change and take actions to prevent or minimise the damage caused. As a result of rising global temperatures, among other impacts, Australia is expected to experience more frequent and intense extreme heat events with longer fire seasons, as well as declining cool season rainfall in southern regions contrasted by more intense heavy rainfall events.20 These changes will increase the exposure of communities and infrastructure to heat-related impacts and bushfire events, while both worsening water availability and drought risk in some regions and elevating flood risk in others.
Adaptation will be needed to counteract the adverse impacts of these climatic and environmental changes, and a key example of adaptation expenditure is the Disaster Ready Fund (DRF). Announced in the 2022-23 October Budget, the DRF is funded to provide up to $1 billion over five years from 2023-24 to support increased resilience and preparedness of governments, community groups and affected communities, as well as improved understanding of disaster impacts that can be utilised to reduce future risk.21
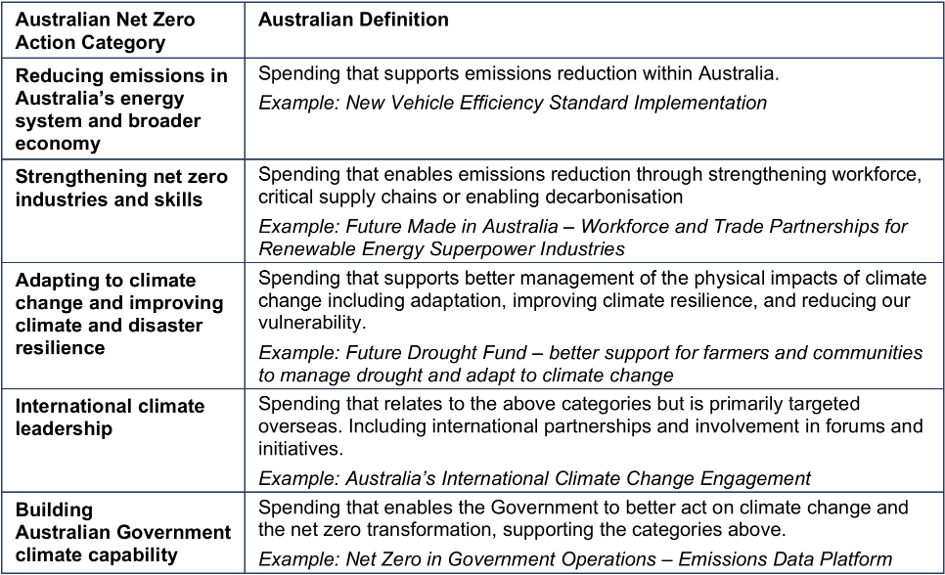
Since the 2022-23 October Budget, each Budget has reported on ‘new net zero spending measures’ since the prior Budget under the classification system as laid out in the 2024-25 Budget (Figure 2-5).22
Figure 2-5: Australia's net zero spending classification system
Source: 2024-25 Budget Paper No. 1, Table 3.6.
Spending reported within this classification covers ‘spending, balance sheet and tax expenditure measures’ and is not equivalent to expenditure as it is usually defined within the Government’s fiscal framework. This is discussed further in Box 3.
Box 3: Classification of climate-related transition spending
In the 2022-23 October Budget, a total of $24.9 billion in committed funding for climate-related spending was announced for 2022-23 to 2029-30. However, the committed funding for payment measures (which impact the UCB) was $4.9 billion. The most significant driver of this difference was the use of alternative financing arrangements, which is explored further in section 1.5: Evolving use of alternative financing arrangements.
This difference was mainly related to the Rewiring the Nation program, providing $20 billion to fund concessional loans and equity investments in transmission infrastructure projects. The full $20 billion was counted towards the value of these net zero spending measures, whereas the measure improved the UCB by $158 million over the forward estimates.
This funding, when deployed, creates financial assets from which the Government can expect future cash flows, which is classified as ‘net cash flows from investments in financial assets for policy purposes’. In line with budget accounting principles, this kind of transaction only impacts the headline cash balance (HCB) and not the UCB.
This report considers an illustrative and stylised scenario of the UCB impact where climate change-related disruption increases government expenditure and decreases economic activity in Australia, beyond that implicitly assumed and incorporated into current projections.23
This scenario aims to show the sensitivity of fiscal outcomes to climate-related risks, rather than provide a projection of what is likely to occur. There is significant uncertainty about potential future outcomes, and in the case of mitigation and adaptation expenditure, the exact course of future spending will be determined by the actions of successive governments.
Additionally, although the three broad categories discussed are presented separately for illustrative purposes, in practice they are likely to be interdependent. Effective mitigation and adaptation measures may reduce both future direct costs and indirect impacts associated with climate-related events and environmental changes by strengthening resilience and reducing exposure to climate risks. However, the extent and timing of these interactions are uncertain and depend on future policy choices, technological developments and broader economic and environmental conditions. Consistent with the illustrative nature of this scenario, the PBO has not attempted to predict or model these interactions.
The scenario is based on the following assumed impacts:
Direct costs: In 2024, the Government released the Independent Review of Commonwealth Disaster Funding (‘The Colvin Review’), which includes detailed analysis and projections of disaster funding expenditure:
- Commonwealth disaster funding costs between 2018-19 and 2022-23 were $15.9 billion, or an average of around $3.2 billion per year.24
- AAverage Commonwealth annual disaster funding costs (in nominal terms) were projected to rise to around $17.9 billion per year by 2049-50 excluding the impacts of worsening climate change.25 This corresponds to a projected annual cost of around $7.5 billion by 2036-37, based on PBO analysis.
To incorporate the additional impacts of climate change on top of these projections, the PBO has assumed that climate change will increase disaster-related costs by an additional 25% by 2036-37.
For this scenario, direct costs are projected to increase over the medium term from around $3.9 billion (0.13% of GDP) in 2026-27 to $9.4 billion (0.19% of GDP) by 2036-37.26
Indirect economic impacts: As discussed earlier, there is significant uncertainty and disagreement around quantifying the impact of climate change on GDP. As such, the PBO has assumed a relatively small impact for the purposes of this analysis to illustrate that even small changes to overall economic activity can have notable impacts on fiscal outcomes.
For this scenario, the PBO has assumed that adverse climate impacts would decrease nominal GDP by 1.0% by 2036-37 (relative to the budget’s baseline projections). This is towards the lower end of the range of impacts reported in the literature and is intended to illustrate that even relatively modest effects on economic activity can have material fiscal consequence.
Mitigation and adaptation expenditure: Based on analysis of net zero and climate-related spending measures announced between the 2022-23 October and 2026-27 Budgets, the PBO estimates that the annual UCB impact of government expenditure on these measures has increased from around $600 million (0.02% of GDP) in 2022-23 to $4.6 billion (0.15% of GDP) in 2026-27.
Based on an extrapolation of this historical trend, for this scenario, mitigation and adaptation expenditure is assumed to increase over the medium term from around $4.6 billion (0.15% of GDP) in 2026-27 to $12.0 billion (0.24% of GDP) by 2036-37.
Aggregating the 3 impacts above together as a stylised scenario, Figure 2-6 shows that the UCB (as a share of GDP) would be around 0.9% lower by the end of the medium term with a cumulative impact of $214 billion over the medium term. Such a scenario would see the budget only just return to surplus in 2036-37, rather than in 2034-35 under the baseline.
Figure 2-6: Climate change scenario - Underlying cash balance, 2026-27 to 2036-37
Source: Independent Review of Commonwealth Disaster Funding, PBO Historical Fiscal Data, 2026-27 Budget and PBO analysis.
Note: Scenario analysis accounts for expenditure already incorporated into 2026-27 Budget forecasts.
Increasing state and territory debt has potential implications for the Commonwealth in terms of the overall Australian debt burden.27
The International Monetary Fund noted in its latest assessment of Australia’s finances that ‘higher sub-national debt could eventually impact Commonwealth borrowing costs’.28 Increasing state debt could also risk increasing pressure for transfers from the Commonwealth to maintain services.
Figure 2-7: General government sector gross debt, 2004-05 to 2029-30
Source: ABS from years 2002-03 to 2023-24 and Commonwealth and state budgets from years 2024-25 to 2029-30.
Note: The variance in figures between ABS data and state budgets is due to the adoption of newer accounting standards in government financial reporting. Other divergences may occur due to timing recognition and other conceptual determination differences.
Projected total state and territory general government sector gross debt was around $650 billion, or 21% of GDP in 2026-27 while Commonwealth gross debt was around $1 trillion, or 34% of GDP.29
Since the COVID-19 pandemic, total state gross debt has grown at a faster rate than the Commonwealth (Figure 2-7). From 2020-21 to 2029-30, Commonwealth gross debt as a percentage of GDP is expected to decrease by 19% while the state gross debt is expected to rise by 62%. Total state gross debt remains lower than that of the Commonwealth.
The latest projections of both Commonwealth and state gross debt as a percentage of GDP are expected to increase at an average annual rate of around 2% over the 2026-27 Budget forward estimates period. By 2029-30, Commonwealth gross debt is estimated to be 35.6% of GDP while state gross debt is estimated to be 22.0% of GDP.
Further analysis on the Commonwealth and state picture is available in the PBO publication National Fiscal Outlook. The latest edition published in 2025 showed that for 2026-27, Western Australia has the lowest forecast gross debt as a share of gross state product (GSP) with 8.3% of GSP ($36 billion) while the Northern Territory has the highest at 36.3% of GSP ($15 billion). In 2026-27, the state with the highest dollar value of debt is Victoria at around $215 billion (30.7% of GSP), followed by New South Wales at around $195 billion (20.4% of GSP).
3 Long-term fiscal sustainability
- Based on current projection scenarios, the Commonwealth’s fiscal position remains sustainable over the long-term to 2069-70.
- Using the PBO’s long-term fiscal sustainability framework, debt to GDP trends downwards in 24 of the 27 scenarios considered, but is sensitive to budget balance assumptions.
- Structural pressures - including weaker productivity, and rising pressures in tax bases (such as fuel excise) and government spending - increase the likelihood of less favourable long-term outcomes.
In this report, fiscal sustainability refers to the government’s ability to maintain its long-term fiscal policy settings indefinitely without the need for major remedial policy interventions. The PBO’s fiscal sustainability framework tests the trajectory of future government debt through scenarios based on historical experience. Our ‘central’ scenario assumes that future governments can maintain budget balances making policy adjustments, similar to those of the past on average, in response to downturns and upswings.30
Other scenarios examine future paths for government debt based on economic and budget assumptions that reflect historical periods of lower and higher economic and fiscal outcomes.
The fiscal position is sustainable where the debt to GDP ratio is expected to be stable or trend downwards over the long term under most scenarios considered. This provides governments the fiscal space to pursue policies that support long-term economic growth and flexibility for governments to respond to changes in economic conditions, including downturns, either through automatic or discretionary mechanisms.
The long-run trajectory for the debt-to-GDP ratio is driven by 3 parameters: the primary headline cash balance (HCB) (HCB before interest payments); the interest rates that apply to government debt; and economic growth (nominal GDP).31
The budget does not necessarily need to be balanced or in surplus to reduce the debt-to-GDP ratio. If the rate of economic growth exceeds the rate of interest on debt, debt-to-GDP can be reduced with sufficiently small budget deficits. Accordingly, budget deficits can be consistent with a fiscally sustainable position.
A sustainable position also does not mean the debt-to-GDP ratio will not increase at times, especially in response to large unforeseen economic shocks, such as the COVID-19 pandemic. In this sense, it is not necessarily the level of debt that determines if the fiscal position is sustainable, but whether, on average, the debt-to-GDP ratio is expected to remain stable over the medium and long term.
Sustainable fiscal settings should also preserve fiscal flexibility to respond to future economic and fiscal shocks. While the long-term trajectory of debt relative to GDP is a key indicator of sustainability, the level of debt also matters. Repeated shocks that leave debt at progressively higher levels would reduce the range or effectiveness of future policy responses.
By comparison, in the scenario where the debt-to-GDP ratio is projected to trend upwards over the long term, the fiscal position may not be sustainable. In such circumstances, more significant interventions – beyond those historically employed by governments – would be needed to reduce deficits and keep debt broadly stable as a percentage of GDP.
In the PBO’s fiscal sustainability analysis, 27 possible scenarios for the debt-to-GDP ratio are examined over a 40-year period. Each scenario reflects variations in 3 parameters (the primary HCB, interest rates and economic growth) and is consistent with low, middle and high ranges throughout history. These variations are referred to as ‘cases’. For example, one scenario might combine the middle case for the budget balance, the best case for interest rates and the worst case for GDP growth.
Each of these scenarios represent a possible future trajectory for the debt-to-GDP ratio, but the PBO does not make any judgement as to which scenario is most likely. For instance, the middle scenario should not be considered as a baseline or most-likely trajectory. Instead, the PBO is illustrating what the path could be under a range of economic and policy conditions.
Importantly, the overall best- and worst-case scenarios represent combinations of interest rates and economic growth that would be unlikely to persist for an extended period of time. For example, should economic growth slow to the rate assumed in the worst scenario, the Reserve Bank of Australia (RBA) may respond by lowering interest rates, offsetting the impacts on the budget balance. The extreme scenarios are intended to illustrate that the budget is generally sustainable even assuming highly unlikely combinations of long-term economic growth, interest rates and budget balances.
By building the scenarios around historical averages, the PBO has implicitly captured the impact of future economic shocks and policy changes, to the extent that these are of a similar magnitude and regularity to those of the past. However, if future economic or climate change shocks were comparatively larger or more frequent than historical shocks, or if long-term structural shifts meant that GDP growth rates were comparatively much lower, this would make maintaining a fiscally sustainable position more difficult.
The PBO also uses historical average budget balances to guide the scenarios, on the basis that future governments can respond to their challenges to a similar extent as those of the past. It is important to note, however, that some past government actions may not be available in the future. For example, certain assets cannot be resold (e.g. the Commonwealth Bank or Telstra) and some taxes cannot be reintroduced (e.g. the GST).
For further information on the framework the PBO uses to assess fiscal sustainability, see the PBO’s report on Fiscal sustainability.
Table 3-1 shows our middle, best and worst cases. The results of all 27 scenarios are shown in Figure 3-1.32
Table 3-1: Cases for worst, middle and best scenarios
|
Parameters |
||||
|
Cases |
|
Interest rates |
Nominal GDP |
Primary HCB |
|
Worst |
|
Interest rates reach 5.0% by 2069-70 |
Nominal GDP growth reaches 3.7% by 2069-70 |
The budget balance remains broadly balanced |
|
Middle |
|
Interest rates reach 4.4% by 2069-70 |
Nominal GDP growth reaches 4.4% by 2069-70 |
The budget maintains a sustained modest surplus |
|
Best |
|
Interest rates reach 3.7% by 2069-70 |
Nominal GDP growth reaches 5.0% by 2069-70 |
The budget maintains a sustained stronger surplus |
Across most scenarios in the PBO’s framework from the end of the forward estimates, the Commonwealth’s fiscal position is projected to remain sustainable over the long term, with government debt stabilising and declining as a share of GDP.
In 24 out of the 27 long term scenarios, the debt-to-GDP ratio is expected to trend downwards over the long term. This suggests that the fiscal position is likely to continue to be sustainable in all but the most extreme circumstances if governments pursue historical policy settings.
The middle scenario’s debt-to-GDP ratio will peak in 2028-29 at 35.8% of GDP.
Figure 3-1: Gross debt – Fiscal sustainability scenarios, 1979-80 to 2069-70
Source: 2026-27 Budget and PBO analysis.
Some of the 27 scenarios may be more plausible than others. In particular, there are structural factors that suggest the downside scenarios may be relatively more likely to persist than the upside cases.
Over the long term, it is possible that economic growth may not return to historical averages, largely as a result of productivity growing less in the future than it has in the past. This is a plausible risk, given the slowing of productivity growth internationally and in Australia.
Budget balances may also weaken relative to historical norms due to ongoing structural pressures on the budget balance. Reliance on personal income taxes is projected to increase over the coming decades (Chapter 4) including following the taxation changes announced in the 2026-27 Budget. While structural expenditure pressures such as ageing-related spending, defence and fiscal impacts associated with the response to climate change will also continue to grow.
Figure 3-2 demonstrates the impact of lower economic growth on the debt-to-GDP ratio. This scenario shows the impact of lower economic growth (3.6% nominal annual growth instead of 4.4%), while keeping the budget balance and interest rates similar to the central scenario.
Figure 3-2: Gross debt – Fiscal sustainability, lower economic growth, 1979-80 to 2069-70
Source: 2026-27 Budget and PBO analysis.
Figure 3-3 demonstrates the impact of a lower budget balance on the debt-to-GDP ratio. This scenario shows the impact of lower budget balances (0.0% of GDP surplus instead of 1.6% of GDP surplus) while keeping economic growth and interest rates similar to the central scenario.
Figure 3-3: Gross debt – Fiscal sustainability, lower budget balance, 1979-80 to 2069-70
Source: 2026-27 Budget and PBO analysis.
These scenarios highlight the sensitivity of long-term fiscal sustainability to the management of the budget balance. Under the lower economic growth scenario, by the end of the scenario period in 2069-70, gross debt-to-GDP falls to around 5%, whereas lower budget balances results in debt-to-GDP remaining around 30%.
4 Revenue
- Total revenue is projected to increase from 26.4% of GDP in 2026-27 to 27.4% in 2036-37.
- Personal income taxes remain the largest source of revenue and will continue to grow over the medium term, projected to account for 47.9% of total revenue in 2026-27, and up to 53.8% by 2036-37.
- Personal income taxes are also the only major revenue source projected to increase as a share of GDP over the medium term, rising from 12.6% of GDP in 2026-27 to 14.7% of GDP in 2036-37, largely due to bracket creep.
- Continuing recent trends, excise revenue is projected to decline further over the medium term from 1.3% of GDP in 2026-27 to 1.1% of GDP in 2036-37. This is predominantly driven by fuel excise due to the continued shift towards electric vehicles (EVs) but also relates to tobacco excise.
Total revenue is forecast to dip from 26.4% of GDP in 2026-27 to a low of 25.9% in 2028-29 before a projected increase to 27.4% of GDP in 2036-37 (Figure 4-1).
Over the medium term, revenue is projected to increase as a share of GDP driven by increasing personal income taxes. This reflects the impact of bracket creep plus the growing impact of new taxation measures announced at the 2026-27 Budget.
Compared to the 2025-26 Budget forecasts, total revenue projections have increased by around $50.4 billion over the forward estimates, almost entirely across the first 2 years (2026-27 and 2027-28) due to higher projected commodity prices, which are expected to return to normal levels during the forward estimates.
For further discussion of these projections, see section 4.2: Drivers of changes in revenue.
For a more detailed breakdown of revenue projections, see Table B-1 in Appendix B.
Figure 4-1: Total revenue, 2006-07 to 2036-37
Source: 2025-26 Budget, 2026-27 Budget, PBO analysis.
Trends in revenue growth
Projected revenue growth over the medium term is predominantly driven by personal income taxes, the only source of revenue projected to increase materially as a share of GDP (see Figure 4-2), from 12.6% of GDP in 2026-27 to 14.8% by 2036-37. Much of this projected growth can be attributed to bracket creep, which is explored further in Section 4.3.
Company tax revenue is higher in 2026-27, primarily due to higher commodity prices, but is projected to decline over the forward estimates from 5.1% of GDP in 2026-27 to 4.4% by 2029-30, then remain broadly stable at this level to 2036-37.
Indirect taxes are also projected to decline from 5.5% of GDP in 2026-27 to 5.3% by 2036-37, driven primarily by excise revenue declining from 1.3% to 1.1% of GDP over this period. For further detail, see section 4.4: Trends in excise revenue.
Figure 4-2: Tax revenue by type, 2006-07 to 2036-37
Source: PBO Historical Fiscal Data, 2026-27 Budget and PBO analysis.
Note: Indirect tax revenue includes GST, excise and customs duties and other taxes not named.
Personal income taxes are projected to continue to grow faster than the economy over the medium term, while all other major sources of revenue remain broadly flat (Figure 4-2). As such, personal income taxes will make up half of total revenue by 2029-30 and 53.8% of total revenue by 2036-37, decreasing the share of other revenue sources (Figure 4-3).
Figure 4-3: Selected revenue sources as a proportion of total revenue, 2004-05 to 2036-37
Source: PBO Historical Fiscal Data, 2026-27 Budget and PBO analysis.
Note: Darker columns indicate historical data, lighter columns indicate forecasts and projections.
Box 4: Commodity prices, company tax and the budget
Australian company tax revenue has been volatile over history, with yearly growth falling 7.3% in 2019-20 and increasing 27.0% in 2021-22. Commodity prices – particularly for iron ore, gas and coal – are a key determinant of company tax revenue, which can turn out very differently than forecast. For example, the initial forecast for company tax for 2015-16 of $85.9 billion was $22.4 billion (35%) higher than the outcome of $63.5 billion. More recently, company tax forecasts have been lower than the outcomes, such as for 2023-24, where the initial forecast of $93.9 billion was $49.0 billion (34%) lower than the outcome of $142.9 billion.
If these very recent trends in forecasts were to continue, sustained higher commodity prices would support higher GDP and improvements to the fiscal position in the near term, although raised commodity prices are typically volatile and may not persist over the medium term. For the purpose of exploring potential revenue upsides, Figure 4-4 presents the estimated fiscal impact under 3 commodity price scenarios where prices turn out much higher than assumed.
Figure 4-4: Commodity price impact on underlying cash balance, 2025-26 to 2036-37
Source: 2025-26 Budget, 2026-27 Budget and PBO analysis.
However, if company tax outcomes continue to be an average of only 0.4% of GDP higher than initially forecast, as it has been over the past decade, corresponding to commodity prices being around 16% higher than assumed, the UCB would be improved by $20.6 billion in 2036-37. This additional revenue would not offset the estimated fiscal impacts of returning bracket creep, or extending spending on programs assumed to expire, both risks discussed earlier in section 2.2: The fiscal trajectory is subject to a range of policy uncertainties.
Changes from the previous MTBO
Compared to the 2025-26 MTBO forecasts and projections, there have been notable changes to revenue projections, as shown in Figure 4-5.33
Over the forward estimates, total revenue estimates have been increased by $50.4 billion, almost entirely across the first 2 years – 2026-27 and 2027-28. This is driven by increases to income taxes across those years, particularly company tax due to raised commodity prices and personal income taxes due largely to stronger forecast employment and wages growth.34 By the end of the forward estimates these upwards revisions since the previous budget have been unwound, with budget estimates for both personal income taxes and company tax for 2028-29 lower than estimated a year ago. These revisions broadly continue through the medium term.
For the coming decade, total revenue projections have increased by $20.4 billion compared to last year’s report, with the increase over the forward estimates partially offset by $30.0 billion less in revenue between 2030-31 and 2035-36.35 These later revenue downgrades are driven by significant downward revisions to company tax as well as excise and customs duties, partially offset by higher expected GST and visa application charges.37
Figure 4-5: Change in revenue projections since 2025-26 Budget
Source: 2025-26 Budget, 2026-27 Budget and PBO analysis.
Proportionally, the largest changes since the 2025-26 Budget were:37
- Excise and customs duties: Across 2026-27 to 2035-36, projected revenue has decreased by 9% from a total of $499 billion to $452 billion. This is driven by significant downward revisions for tobacco excise, which are discussed further in Section 4.4.
- Visa application charges: Across the forward estimates, budget papers show revenue projections have increased substantially from $18.5 billion to $27.0 billion.38 Around a third of this increase was attributable to policy and parameter changes in the 2025-26 MYEFO. The 2026-27 Budget also included measures to increase visa application charges, including a 25% increase in the charge for several visa classes from 1 July 2026. 39 Carrying this higher revenue level forward over the medium term, the PBO projects a $28 billion increase in revenue across 2026-27 to 2035-36, from $51 billion to $79 billion.
Box 5: Decisions taken but not yet announced (DTBNYA) and not for publication (NFP) in the 2026-27 Budget
While the vast majority of the policy decisions are published as measures, the budget also includes the fiscal impacts of DTBNYA and NFP.
DTBNYA reflects the value of policy decisions incorporated into Budget forecasts that have not yet been disclosed because the policy has not been announced.
NFP reflects the value of policy decisions incorporated into Budget forecasts that cannot be disclosed because the values are sensitive in nature, usually due to commercial-in-confidence or national security sensitivities.
In the 2026-27 Budget, the combined impact of DTBNYA and NFP receipts was an increase in government receipts of $14.4 billion over the forward estimates.40 This is the largest ever to appear in a Budget (Figure 4-6).41
For further information, see PBO’s Glossary and Budget Explainer on the Contingency Reserve.
Figure 4-6: Historical DTBNYA and NFP receipts over the forward estimates by economic update
Source: 2026-27 Budget, PBO Historical Fiscal Data and PBO analysis.
Note: Values shown are the total over the forward estimates period for the relevant economic update. Values shown for some but not all economic updates include NFP.
In the absence of further announced personal income tax policy, the PBO projects that average tax rates will continue increasing from 24.9% in 2026-27 to a historical high of 28.6% by 2036-37, mostly driven by bracket creep (Figure 4-7).
For a progressive tax system featuring tax brackets, bracket creep occurs when nominal wage growth increases individuals’ incomes so their average tax rate rises over time, including as a result of moving into higher tax brackets. This increases average tax rates and budget revenue each year without any explicit policy change.42
Bracket creep is particularly prevalent in times of economic growth and inflation and has played an important role in fiscal consolidation after previous major downturns, including the 1990s recession, the Global Financial Crisis and the COVID-19 pandemic.
Figure 4-7 shows the average personal income tax rate from 1966-67 to 2036-37, including historical policy changes that have notably impacted the average tax rate.43
Figure 4-7: Aggregate average personal income tax rate, 1966-67 to 2036-37
Source: ATO Taxation Statistics, 2026-27 Budget and PBO analysis.
Note: For consistency across time, net tax before 2000-01 is calculated before allowance for franking credits. Data for non taxable individuals is unavailable prior to 1978-79. The net tax rate prior to 1978-79 assumes that taxable income for non taxable individuals has the impact of reducing the average tax rate by around 0.7 percentage points, the median amount from 1978-79 to 1987-88.
Like the budget’s projections, these projections are under a ‘no policy change’ assumption. In policy areas such as personal income tax, this assumption is unrealistic as it effectively assumes that the Government will not provide any future personal income tax cuts for a decade. The fiscal implications of this ‘optimistic bias’ are discussed in Section 2.2.
Following Federation in 1901, excise taxes comprised most of the Commonwealth’s revenue. However, their contribution has been in long-term decline, shrinking from around 2.6% of GDP in 2006-07 to a projected 1.3% of GDP by 2026-27. This trend is expected to continue over the medium term (Figure 4-8) as contemporary economic and social developments continue to undermine the tax base for all forms of excise, with total excise revenue expected to decline further from 1.3% of GDP in 2026-27 to 1.1% of GDP in 2036-37.
Figure 4-8: Excise revenue projections, 2016-17 to 2036-37
Source: 2026-27 Budget, PBO Historical Fiscal Data and PBO analysis.
Fuel excise makes up a majority of excise revenue, expected to be around 71% in 2026-27, and is the largest contributor to its decline over the medium term, projected to fall from 0.91% of GDP in 2026-27 to 0.78% by 2036-37. This is driven by the increased adoption of electric and hybrid vehicles, creating a long-run structural decline in fuel usage and fuel excise revenue. The CSIRO projects that more than one-quarter of cars in Australia are likely to be electric by 2036-37.44
Tobacco excise is the fastest declining excise tax relative to its size, projected to halve over the medium term as a share of GDP, from 0.12% of GDP in 2026-27 to 0.06% of GDP by 2036-37.
Tobacco excise has been used as a policy lever to significantly increase the cost of legal tobacco with the aim of reducing consumption. However, this has led to a significant shift from legal to illicit tobacco consumption in Australia – estimated at around 80% of all consumption in 2025 – and resulting in a sharp drop in tobacco excise revenue.45
In addition to this decline, tobacco excise has also been the dominant driver behind subsequent downwards revisions in excise revenue. Between the 2023-24 Budget and 2026-27 Budget, estimates of total excise revenue for 2026-27 have been revised down by $11.1 billion, from $52.1 billion (1.7% of GDP) to $41.0 billion (1.3% of GDP). These revisions were driven almost entirely by tobacco excise which, over this same period, was also revised down by $11.1 billion, from $14.7 billion to $3.6 billion.
Alcohol excise is projected to experience the smallest decline over the medium term, from 0.26% of GDP in 2026-27 to 0.23% of GDP in 2036-37. This is driven by the declining consumption of alcohol on a per capita basis.46
The 2026-27 Budget included 23 revenue measures, a number of which apply to capital as a part of the smaller but key part of the personal income tax base, beyond wage and salary income alone.47 Many of these measures commence in 2027-28 or later and have grandfathering arrangements, so their impact on revenue is expected to be largely beyond the forward estimates.
Figure 4-9 shows the estimated financial impact over the next 10 years for the largest revenue measures in the 2026-27 Budget, based on preliminary PBO estimates.
The measure with the largest negative revenue impact over the medium term is the measure Tax Reform – cutting taxes with a Working Australians Tax Offset, projected by the PBO to reduce revenue by $3.0 billion in 2028-29, growing to $3.9 billion by 2036-37.
Three measures, all affecting personal income taxes, account for the majority of the positive revenue impact of the 2026-27 Budget measures over the medium term. The measures Tax Reform – Boosting Home Ownership – reforming negative gearing and capital gains tax and Tax Reform – introducing a minimum tax on discretionary trusts are each expected to increase revenue by just over $40 billion between 2026-27 and 2036-37.48 Additionally, the measure Electric Car Discount – more sustainable fringe benefits tax treatment of electric cars is estimated by the PBO to increase revenue by around $29.2 billion between 2026-27 and 2036-37.
Taken together, these three positive revenue measures are estimated to increase revenue by around $101.1 billion between 2030-31 and 2036-37, compared with $10.1 billion over the forward estimates.
Figure 4-9: Estimated impact of selected 2026-27 Budget revenue measures over the medium term
Source: 2026-27 Budget and PBO analysis
5 Expenses
- Total expenses as a share of GDP are projected to decrease from a peak of 27.1% of GDP in 2027-28 to 26.2% of GDP in 2036-37.
- In 2026-27, GST payments to states and the Age Pension remain the largest expense programs.
- Interest expenses, defence and hospital funding are projected to be the fastest growing programs over the medium term.
- The Budget measure, Securing the National Disability Insurance Scheme for Future Generations, is projected to save $37.8 billion over the forward estimates.
- Government grants and public service expenses continue to be revised up each budget year as new temporary and ongoing spending is announced.
Total expenses (Figure 5-1) are projected to decrease from a projected peak of 27.1% of GDP in 2027-28 to 26.2% of GDP in 2036-37, averaging 26.7% of GDP across the medium term.
Figure 5-1: Total expenses, 2006-07 to 2036-37
Source: 2026-27 Budget, previous budgets and PBO analysis.
The decline in expenses as a percentage of GDP is across a range of expense programs over the forward estimates and the medium term (Figure 5-2). Some of the largest falls are in the public service, state and territory funding (excluding hospitals) and now the NDIS. In contrast, interest expenses, defence, hospital and aged care expenses are all projected to grow faster than GDP.
These projections do not assume any spending on new or existing programs beyond that which has been announced.
Figure 5-2: Changes in expenses as a % of GDP, 2026-27 to 2036-37
Source: 2026-27 Budget, previous budgets and PBO analysis.
Note: Public service includes the wages and other labour costs for public servants, contracted labour costs and general running costs such as utilities, travel and requisites.
Table 5-1 shows the expense programs with the largest movements across the forward estimates (2026-27 to 2029-30) and medium term (2029-30 to 2036-37), as a percentage of GDP.
Table 5-1: Comparison of the 10 largest expense programs in the 2026-27 Budget
|
|
% of GDP |
$ billion |
% of expense |
||||||
|
|
2026-27 |
2036-37 |
Change (ppt) |
2026-27 |
2036-37 |
Change ($) |
2036-37 |
||
|
GST transfers to states |
3.5 |
3.4 |
-0.1 |
109.8 |
169.0 |
59.2 |
|
13.1 |
|
|
Age pension |
2.2 |
2.3 |
0.0 |
68.7 |
111.8 |
43.1 |
|
8.6 |
|
|
Defence |
1.8 |
2.0 |
0.2 |
56.3 |
97.6 |
41.3 |
|
7.6 |
|
|
Interest expenses |
1.4 |
1.9 |
0.4 |
43.4 |
91.3 |
47.9 |
|
7.1 |
|
|
National Disability Insurance Scheme |
1.7 |
1.5 |
-0.2 |
53.7 |
75.3 |
21.6 |
|
5.8 |
|
|
Public hospitals |
1.2 |
1.5 |
0.3 |
37.4 |
74.4 |
36.9 |
|
5.8 |
|
|
Aged care |
1.4 |
1.5 |
0.1 |
43.8 |
72.6 |
28.8 |
|
5.6 |
|
|
Schools and higher education |
1.5 |
1.3 |
-0.2 |
46.0 |
65.6 |
19.5 |
|
5.1 |
|
|
Medicare Benefits Schedule |
1.2 |
1.3 |
0.1 |
37.6 |
62.6 |
25.0 |
|
4.8 |
|
|
Total public service (non-defence) |
1.8 |
1.2 |
-0.6 |
56.1 |
57.6 |
1.5 |
|
4.5 |
|
|
All other expenses |
9.1 |
8.4 |
-0.6 |
280.5 |
415.1 |
134.5 |
|
32.1 |
|
|
Total expenses |
26.9 |
26.2 |
-0.7 |
833.3 |
1,292.7 |
459.5 |
|
100.0 |
|
Source: 2026-27 Budget and PBO analysis.
Note: Amounts shown here are not identical to those shown in the 2026-27 Budget Paper No. 1 (table 6.1.3) owing to small definitional differences. NDIS includes additional administration expenses and will be slightly higher than figures in this report and the PBO’s Build your own budget tool. Expenses are ranked based on their share of expense in 2036-37. Projections for GST transfers assume that the No Worse Off Guarantee ends as planned in 2029-30. Extending it would increase payments by around $5 billion each year it is extended.
Compared to previous projections, the NDIS is no longer expected to be a major driver of spending growth. This change reflects the 2026-27 Budget measure Securing the National Disability Insurance Scheme for Future Generations. Projecting the NDIS forward estimates expenses over the medium term results in projected NDIS expenses reducing by around $170 billion between 2026-27 and 2035-36 (see 5.3).
The savings in the NDIS expenditure growth are largely offset by increased expenditure in other areas. The largest upward revisions have been in grants to the states (particularly for hospital funding), interest expenses and other operating expenses.
Table 5-2 compares projected spending by program in 2028-29 and 2035-36 between the 2025-26 MTBO and the 2026-27 MTBO, highlighting the largest revisions. For example, in the 2025-26 MTBO, the NDIS was forecast to cost $62 billion by the end of the 2025-26 forward estimates period in 2028-29 and projected to cost $107 billion by the end of the 2025-26 medium term period in 2035-36, while in this year’s report, the NDIS is now projected to cost $54 billion and $72 billion in those years.
Table 5-2: Revisions of expenses between the previous and current edition of MTBO ($billion)
|
|
|
2028-29 |
|
|
|
2035-36 |
|
|
25-26 MTBO |
26-27 MTBO |
Change |
|
25-26 MTBO |
26-27 MTBO |
Change |
|
|
NDIS |
62.2 |
54.3 |
-8.0 |
|
106.7 |
72.0 |
-34.7 |
|
Public hospitals |
38.8 |
43.7 |
4.9 |
|
60.4 |
69.8 |
9.5 |
|
GST |
117.2 |
120.7 |
3.5 |
|
153.2 |
161.4 |
8.2 |
|
Other operating expenses |
15.6 |
19.9 |
4.3 |
|
23.9 |
29.3 |
5.5 |
|
Interest expenses |
48.4 |
51.5 |
3.1 |
|
86.7 |
93.1 |
6.4 |
|
Total defence spending |
78.7 |
76.5 |
-2.2 |
|
118.9 |
115.4 |
-3.6 |
|
All other expenses |
528.4 |
529.4 |
1.0 |
|
711.6 |
702.7 |
-9.0 |
|
Total expenses |
889.4 |
896.1 |
6.7 |
|
1,261.4 |
1,243.7 |
-17.6 |
Source: 2026-27 Budget, previous budgets and PBO analysis.
Note: ‘Other operating expenses’ is any other operating expense not including public service wages and salaries, public service superannuation, depreciation and amortisation, supply of goods and services, indirect personal benefits and health care payments for veterans. Defence spending excludes depreciation.
In April 2026, the Government committed to a range of reforms to the NDIS which aim to achieve an annual growth in NDIS spending of below 2% over the forward estimates and approximately 5% over the remainder of the medium term.49
The 2026-27 Budget NDIS savings measure reduced projected payments by $37.8 billion over the forward estimates (relative to the latest NDIS Actuary projections), partially offset by NDIS parameter variations of $13.9 billion over the forward estimates. By comparison, the next largest expenditure savings measure in the past decade was the 2024-25 Budget measure National Disability Insurance Scheme – getting the NDIS back on track which was estimated to save $14.1 billion over 4 years.
Figure 5-3 shows historical forecasts for NDIS expenditure along with actual costs – the NDIS has consistently exceeded forecast growth and over the previous 5 years has grown at an average rate of 18.7% each year, highlighting the challenges in achieving this.
Figure 5-3: NDIS expenditure estimates since the 2017-18 Budget
Source: 2026-27 Budget and previous budgets.
If NDIS growth rates were to remain elevated this will put additional pressure on the budget, as illustrated by these comparison points:
- Baseline growth (as forecast in 2026-27 Budget): Annual growth slows to 2% over the forward estimates and 5% over the medium term, supporting a return to surplus by 2034-35 and reducing spending from 1.7% to 1.5% of GDP.
- 5% NDIS year-on-year growth scenario: Growth stabilises at 5% from 2027-28, increasing spending by $13.5 billion in 2036-37 and delaying the return to surplus by one year to 2035-36
- 10% NDIS year-on-year growth scenario: Growth stays at 10%, increasing spending by $68.1 billion in 2036-37 and precluding a return to surplus in the medium term.
The forecast decline in public service spending is the largest projected fall in spending over the forward estimates and medium term (Figure 5-2 above). This reflects the budget’s ‘no policy change’ assumption, such that temporary decisions of government are assumed to end as scheduled, and no new decisions will be made. When temporary decisions end, the associated departmental funding also terminates, reducing projected wages and supplier costs. In practice, future budgets often include new resourcing decisions resulting in expense forecasts being ‘topped up’. Grant funding typically follows the same pattern.
Figure 5-4: Actual and forecast cost of the public service50
Source: 2026-27 Budget and PBO’s Build your own budget tool.
This figure has been updated to correct a charting error.
Over the past 20 years, the cost of the public service has remained steady at around 3.8% of GDP despite budgets having typically estimated a decline of 0.4% of GDP over the forward estimates (Figure 5 4).
Between the 2025-26 Budget and the 2026-27 Budget:
- The additional APS spending was primarily provided through 6 measures to provide additional departmental resourcing, with the largest being $2 billion over the forward estimates for Services Australia. Estimated total wage spending for 2026-27 increased by $3.8 billion between the 2025-26 and 2026-27 Budgets.
- The average staffing level (ASL) of the non-military public services was revised up to 215,941 for 2025-26, higher than the 213,349 estimated in the 2025-26 Budget. In 2026-27, ASL is estimated to increase to 217,256.
Figure 5-5 provides a comparison of how different levels of growth in ASL would impact the UCB as a share of GDP.
- Baseline ASL: PBO assumes the efficiency dividend and indexation of departmental appropriation continue over the medium term in line with current arrangements. The efficiency dividend helps drive the return to budget balance in 2034-35. ASL would be around 189,000 at the end of the forward estimates and 176,000 at the end of the medium term.
- Flat – ASL held constant at 2025-26 level: ASL remains unchanged over the medium term. This increases public service spending by $8.5 billion in 2036-37, delaying the return to surplus by one year to 2035-36. ASL would be 216,000 at the end of both the forward estimates and the medium term.
- Grow with population: ASL grows in line with the population over the medium term. This increases spending on the public service by $14.2 billion in 2036-37, delaying the return to surplus by one year to 2035-36. ASL would be around 226,500 at the end of the forward estimates and 244,500 at the end of the medium term.
Figure 5-5: ASL impact on the underlying cash balance scenarios, 2025-26 to 2036-37
Source: 2026-27 Budget and PBO analysis using the PBO’s Build your own budget tool.
6 About this report
The 2026-27 Medium-Term Budget Outlook (MTBO) presents the PBO’s independent projections for the Australian Government’s balance sheet, major fiscal aggregates, and revenue and expense categories. It also includes the PBO’s assessment of the budget’s long-term fiscal sustainability to 2069-70.
The PBO’s legislation requires us to use the latest fiscal forecasts, policy settings and economic assumptions which were presented in the Australian Government's 2026-27 Budget, published on 12 May 2026. As a result:
- estimates for the 4-year ‘forward estimates’ period (2026-27 to 2029-30) match the budget estimates
- projections over the remainder of the ‘medium term’ (2030-31 to 2036-37) and ‘long term’ (2037-38 to 2069-70) are independently modelled.
The PBO’s projections are based on the same economic assumptions that underpin the budget.
MTBO aims to:
- Analyse fiscal trends by presenting analysis of modelled trajectories of fiscal aggregates over the next decade. Results are generally compared to the previous MTBO editions.
- Identify key fiscal risks by exploring risks and uncertainties, including scenario analysis showing how the fiscal position would alter if different assumptions were applied. The PBO’s complimentary Build your own budget tool also allows readers to explore alternatives to the analysis the PBO presents here by adjusting various policy and economic parameters.
- Provide detailed projections and offers more detailed medium-term fiscal projections than those published in the budget papers, covering each of the major tax and expense programs.
- Assess long-term sustainability with longer-term fiscal analysis that explores the question: ‘If governments maintain budget balances that are similar to historical precedents across economic cycles (even if this budget balance is a deficit), is the fiscal position likely to be sustainable across the long term?’ To answer this, the PBO looks at potential pathways for the gross debt-to-GDP ratio beyond the forward estimates (from 2030-31 onwards) using combinations of:
- the primary headline cash balance (HCB) (HCB excluding interest payments and receipts)
- interest rates
- economic growth (nominal GDP).
Note on terminology in this report
This report uses comparative adjectives to describe how amounts change over time or between forecast periods. While comparative terms such as ‘higher’ and ‘lower’ are straightforward when referring to positive amounts, they can be misleading or ambiguous when applied to negative values. For example, if the UCB changes from -$10 billion to -$5 billion over a given period (i.e., becomes a smaller negative amount), has the UCB increased or decreased?
In these cases, the report uses terms which aim to avoid ambiguity and make the text more readable but inevitably add value judgements and may appear pejorative. In the example, the PBO would say that the UCB ‘improves’. For the reverse case, the PBO would say that the UCB ‘deteriorates’.
As a general rule, the PBO uses positive terms for cases which effectively reduce public debt and negative terms for cases which effectively increase public debt.
In using these terms, the PBO acknowledges that ‘improving’ the UCB may not always be the most effective fiscal strategy and that policy which ‘deteriorates’ the UCB, or ‘worsens’ the debt position, may sometimes be advisable to support a broader policy objective or respond to economic conditions. Making the budget ‘worse’ is not always bad.
Box 6: What is the Parliamentary Budget Office (PBO)?
The PBO was established in 2012 to inform the Parliament by providing independent and non-partisan analysis of the budget cycle, fiscal policy and the financial implications of proposals (Section 64B of the Parliamentary Service Act 1999). The PBO does this in 3 main ways:
- by responding to requests made by senators and members for costings of policy proposals or for analysis of matters relating to the budget
- by publishing a report after every election that provides transparency around the fiscal impact of the election commitments of major parties
- by conducting and publishing self-initiated work that enhances the public understanding of the budget and fiscal policy settings.
For further information and an introduction to the PBO’s services, see Guide to the PBO's services.
Appendices
This appendix outlines the economic context and methodology used in the 2026-27 Medium-Term Budget Outlook (MTBO).
The PBO’s projections methodology
The PBO’s projections are based on the same economic assumptions that underpin the budget and are broadly consistent with the budget’s medium-term outlook. The PBO’s projection for the underlying cash balance (UCB) in 2036-37 is not significantly different to that presented in the budget.
Revenue projections use a ‘base-plus-growth’ methodology. Economic parameters are used to estimate growth rates, which are then applied to the relevant base.
Expenses projections are based on:
- the number of expected recipients receiving payments
- the average cost per person
- adjustments year on year for a range of factors including population growth, demographics, demand for services, and indexation.
The report presents the major fiscal aggregates on both an accrual and cash basis using a balance sheet framework that uses accounting identities, consistent with the PBO’s previous reports. Revenue and expense projections are on an accrual basis.
Estimates presented as a share of GDP use the latest GDP forecasts. If GDP is revised in subsequent budgets, these estimates as a share of GDP may change, including for prior years.
For further information on the PBO’s balance sheet framework, see the PBO’s Beyond the Budget: 2021-22 report.
Bridging the balances
The PBO uses several measures to examine the budget position, including the:
- net operating balance (NOB)
- fiscal balance (FB)
- underlying cash balance (UCB)
- headline cash balance (HCB)
These measures provide different views of the budget depending on timing (cash vs accrual) and the treatment of investment and interest.
For further information about each measure, see the glossary at the end of this report, or the PBO’s online budget glossary.
The 2026-27 Medium-Term Budget Outlook in context
Forecasts and projections of economic parameters underpin the PBO’s analysis. The key economic parameter forecasts are summarised in Budget Paper No. 1 of the 2026-27 Budget (Table 1.1).
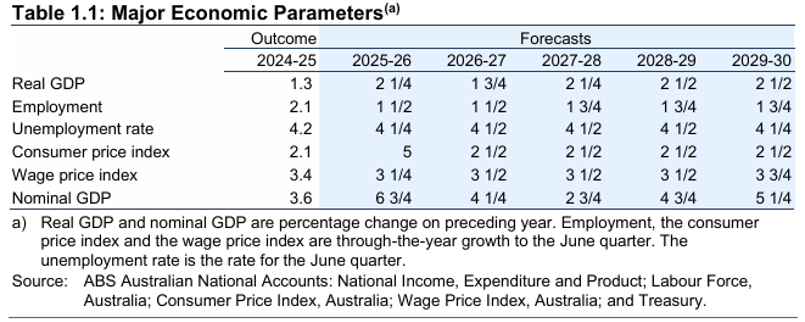
Source: 2026-27 Budget, Budget Paper No. 1, 7.
Compared with the 2025-26 Budget, the 2026-27 Budget (the starting point for the 2026-27 MTBO) shows:
- Economic growth (nominal GDP) is forecast to be higher in 2025-26 and 2026-27 but then lower in almost all years from 2027-28 onward (shown in Figure A-1 below).
- Employment growth is forecast to be slightly higher from 2026-27 onward.
- The unemployment rate is forecast to be slightly higher from 2026-27 onward.
Figure A-1: Nominal GDP growth, 1999-00 to 2036-37
Source: Historical budgets, 2024-25 Budget, 2025-26 Budget, 2026-27 Budget, and PBO analysis.
Note: All values prior to and including 2024-25 are outcomes.
Estimates of fiscal aggregates in the forward estimates period provide the starting point for the PBO’s fiscal projections across the medium- and long-term periods. Estimates of key fiscal aggregates across the forward estimates are also summarised in Budget Paper No. 1 of the 2026-27 Budget (Table 1.2).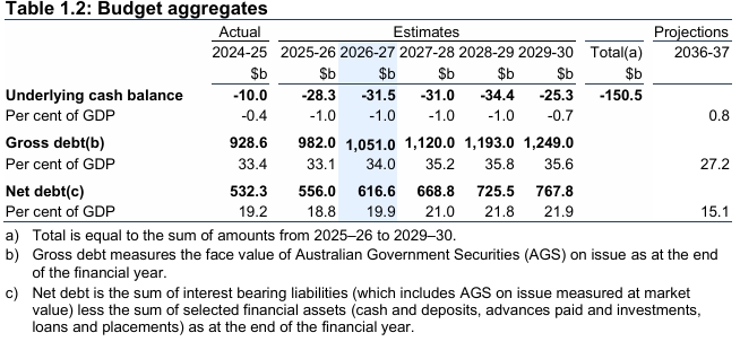
Source: 2026-27 Budget, Budget Paper No. 1, 8.
Changes in the budget aggregates between budgets mainly reflect:
- updated economic conditions
- policy decisions
- revisions to previous years actuals which form the starting point for future forecasts.
Based on the estimates in the 2026-27 Budget, in 2025-26 the UCB improved by around $13.8 billion compared to the forecast in the 2025-26 Budget. Changes in economic conditions, also known as parameter variations, account for most of the difference between budgets and remain larger than the impact of new policy decisions across the period. (see Figure A-2).
Figure A-2: Change in underlying cash balance since the 2025-26 Budget
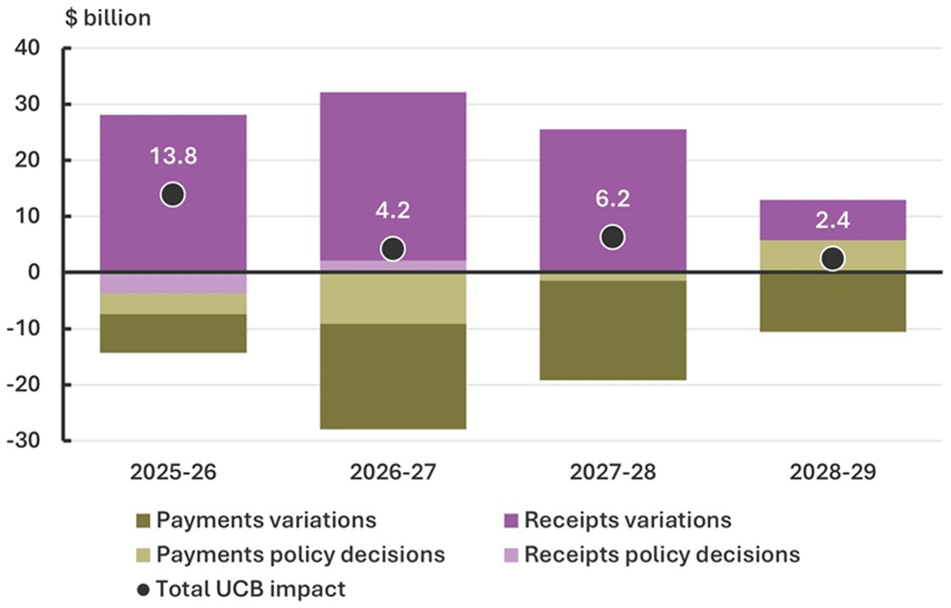
Source: 2025-26 Budget, 2026-27 Budget and PBO analysis.
The main risks to the economic outlook, as articulated in the 2026-27 Budget, are on the downside, with uncertainty around global economic conditions flowing through to Australia. Key risks relate to the impacts of the conflict in the Middle East, high global oil prices and the resulting higher than anticipated inflation and interest rates. More detail on the economic outlook and the risks is in Budget Statement 2: Economic Outlook.
Medium-term fiscal strategy
The 2026-27 Budget fiscal strategy was updated from the 2025-26 Budget, to include a greater focus on sustainability. This was underpinned by ‘working to put downward pressure on payments-to-GDP, including by taking action on structural fiscal pressures’, ‘finding savings and reprioritisations to strengthen the budget over time’ as well as a new objective to lower the tax burden on working Australians over time.51
Table B-1: Comparison of revenue programs
|
% of GDP |
$ billion |
% of revenue |
|||||||
|
2026‑27 |
2036‑37 |
Change (ppt) |
2026‑27 |
2036-37 |
Change ($) |
2036-37 |
|||
|
Personal income taxes |
12.6 |
14.7 |
2.1 |
390.9 |
726.9 |
336.0 |
53.8 |
||
|
Company tax |
5.1 |
4.5 |
-0.6 |
157.0 |
221.6 |
64.6 |
16.4 |
||
|
Goods and services tax |
3.5 |
3.6 |
0.1 |
109.2 |
176.8 |
67.7 |
13.1 |
||
|
Non-tax revenue |
1.9 |
1.8 |
-0.1 |
|
59.0 |
90.2 |
31.2 |
|
6.7 |
|
Total excise and customs duty |
1.3 |
1.1 |
-0.2 |
39.9 |
52.6 |
12.7 |
3.9 |
||
|
Superannuation fund taxes |
1.0 |
0.8 |
-0.2 |
31.6 |
41.3 |
9.7 |
3.1 |
||
|
Other taxes and charges |
0.6 |
0.5 |
0.0 |
|
17.7 |
26.2 |
8.5 |
|
1.9 |
|
Fringe benefits tax |
0.2 |
0.2 |
0.0 |
5.8 |
9.5 |
3.6 |
0.7 |
||
|
Resource rent taxes |
0.1 |
0.0 |
0.0 |
2.0 |
2.0 |
0.1 |
0.1 |
||
|
Luxury car tax |
0.0 |
0.0 |
0.0 |
1.1 |
1.7 |
0.6 |
0.1 |
||
|
Wine equalisation tax |
0.0 |
0.0 |
0.0 |
1.2 |
1.6 |
0.5 |
0.1 |
||
|
Total revenue |
26.4 |
27.4 |
1.0 |
815.3 |
1,350.5 |
535.1 |
100.0 |
||
Source: 2026-27 Budget and PBO analysis.
Note: ‘Change’ refers to the total change between 2026-27 and 2036-37. Numbers may not sum due to rounding.
Table B-2: Comparison of expense programs
|
|
% of GDP |
$ billion |
% of expenses |
||||||
|
|
2026-27 |
2036-37 |
Change (ppt) |
2026-27 |
2036-37 |
Change($) |
2036-37 |
||
|
GST transfers to states |
3.5 |
3.4 |
-0.1 |
109.8 |
169.0 |
59.2 |
13.1 |
||
|
Age pension |
2.2 |
2.3 |
0.0 |
68.7 |
111.8 |
43.1 |
8.6 |
||
|
Defence |
1.8 |
2.0 |
0.2 |
56.3 |
97.6 |
41.3 |
7.6 |
||
|
Interest expenses |
1.4 |
1.9 |
0.4 |
43.4 |
91.3 |
47.9 |
7.1 |
||
|
National Disability Insurance Scheme |
1.7 |
1.5 |
-0.2 |
53.7 |
75.3 |
21.6 |
5.8 |
||
|
Public hospitals |
1.2 |
1.5 |
0.3 |
37.4 |
74.4 |
36.9 |
5.8 |
||
|
Aged care |
1.4 |
1.5 |
0.1 |
43.8 |
72.6 |
28.8 |
5.6 |
||
|
Schools and higher education |
1.5 |
1.3 |
-0.2 |
46.0 |
65.6 |
19.5 |
5.1 |
||
|
Medicare Benefits Schedule |
1.2 |
1.3 |
0.1 |
37.6 |
62.6 |
25.0 |
4.8 |
||
|
Total public service (non-defence) |
1.8 |
1.2 |
-0.6 |
56.1 |
57.6 |
1.5 |
4.5 |
||
|
Disability support pension |
0.8 |
0.8 |
-0.0 |
26.2 |
40.5 |
14.3 |
3.1 |
||
|
Pharmaceutical Benefits Scheme |
0.8 |
0.7 |
-0.1 |
23.4 |
33.9 |
10.5 |
2.6 |
||
|
Child care subsidies |
0.5 |
0.6 |
0.0 |
16.9 |
28.5 |
11.6 |
2.2 |
||
|
Income support for the unemployed |
0.6 |
0.5 |
-0.1 |
18.3 |
22.8 |
4.5 |
1.8 |
||
|
Carer income support |
0.4 |
0.4 |
0.0 |
13.4 |
21.7 |
8.2 |
1.7 |
||
|
Family tax benefit |
0.6 |
0.4 |
-0.2 |
18.2 |
20.3 |
2.1 |
1.6 |
||
|
Fuel tax credits |
0.3 |
0.4 |
0.0 |
10.8 |
17.8 |
7.1 |
1.4 |
||
|
Veterans |
0.4 |
0.3 |
-0.1 |
12.3 |
12.9 |
0.6 |
1.0 |
||
|
Infrastructure grants (road and rail) |
0.4 |
0.2 |
-0.2 |
12.6 |
11.2 |
-1.4 |
0.9 |
||
|
Parenting payment |
0.3 |
0.2 |
-0.0 |
8.3 |
11.2 |
2.9 |
0.9 |
||
|
Private health insurance rebate |
0.3 |
0.2 |
-0.1 |
7.9 |
9.6 |
1.7 |
0.7 |
||
|
Parental leave pay |
0.2 |
0.1 |
-0.0 |
4.7 |
7.0 |
2.3 |
0.5 |
||
|
Student payments |
0.1 |
0.1 |
-0.0 |
3.1 |
4.7 |
1.6 |
0.4 |
||
|
Other expenses |
3.4 |
3.5 |
0.1 |
104.4 |
173.0 |
68.6 |
13.4 |
||
|
Total expenses |
26.9 |
26.2 |
-0.7 |
833.3 |
1,292.7 |
459.5 |
100.0 |
||
Source: 2026-27 Budget and PBO analysis.
Note: ‘Change’ refers to the total change between 2026-27 to 2036-37. Numbers may not sum due to rounding. Defence expenses/spending from 2026-27 to 2029-30 is based on the 2026-27 Budget estimates. For 2030-31 to 2035-36, the PBO has assumed expenses grow in line with the medium-term projections of consolidated defence funding that were published in the 2026 National Defence Strategy. For 2036-37 the PBO has assumed defence spending would be maintained at the same level of GDP as 2035-36.
For more explanation of these and other terms, see our Online budget glossary. |
|
|
Accrual accounting |
Accrual accounting records income when it is earned, and records costs when they are incurred, regardless of when the related cash is received or paid. Under accrual accounting, government income is called ‘revenue’ and costs are generally called ‘expenses’. As an example, under accrual accounting, goods and services tax revenue is recorded in the financial year that the goods and services are purchased, even though the government may not receive the related tax amounts until the following financial year. |
|
Cash accounting |
Cash accounting records income when cash is received, and records costs when cash is paid out, regardless of when those amounts are earned or incurred. For example, under cash accounting, goods and services tax receipts are recorded in the financial year they are received, even though those tax amounts may relate to goods and services purchased in the previous financial year. Under cash accounting, government income is called ‘receipts’ and costs are called ‘payments’. |
|
Expenses |
Expenses in the budget context refers to the cost of providing government services, excluding costs related to revaluations such as the write down of assets. Examples include spending on programs such as the Age Pension or Medicare, funding provided to the states and territories for public hospitals, or the wages paid to Australian Government employees. |
|
Fiscal balance |
The fiscal balance is an accrual accounting measure of the budget balance equal to the government's revenue (for example from taxes) minus its expenses (from providing services such as Medicare and income support such as the Age Pension), adjusted for government capital investments such as military equipment (known as 'net capital investment in non-financial assets') when they are acquired or sold. |
|
Fiscal sustainability |
The government’s ability to maintain its long-term fiscal policy arrangements indefinitely, without the need for major remedial policy action. A fiscally sustainable position is one which can be maintained while pursuing similar borrowing and repayment approaches over the long term, such that taxation and spending can be expected to operate within reasonable and expected bounds. |
|
Gross debt |
In the budget papers, gross debt is the sum of interest-bearing liabilities, consisting of Australian Government Securities on issue, based on their value when the securities were issued (their 'face value'). Gross debt does not include any of the government’s financial assets that partly offset that debt, or any smaller debts that are not Australian Government Securities. |
|
Headline cash balance |
The headline cash balance is a cash measure of the budget balance equal to the government's receipts (for example from tax collections) minus payments for operations and investment activities (including certain investments in financial assets). If receipts are lower than payments, the headline cash balance is in deficit, meaning the government does not have sufficient cash to cover its activities and must borrow from financial markets. |
|
Interest payments |
Interest payments are the cash payments on the government’s debt liabilities which are recorded as a cost to government in the budget. Net interest payments are equal to interest payments minus the cash interest receipts earned by the government on investments in interest-bearing financial assets. |
|
Net debt |
Net debt is the sum of selected financial liabilities (including deposits held, advances received, government securities, loans, and other borrowings) less the sum of selected financial assets (including cash and deposits, advances paid, and investments, loans, and placements). It is a common measure of the strength of a government’s financial position. In the net debt calculation, Australian Government Securities are valued at the price they are currently trading at (their 'market value') rather than their value when the securities were issued (their 'face value'). |
|
Net financial worth |
Net financial worth measures the total financial assets (such as cash or shares in a company) held by a person or organisation at a fixed point in time, minus the value of any liabilities, such as outstanding debts. Net financial worth is a broader measure of the government's financial position than net debt, but it is narrower than net worth. |
|
Net operating balance |
Net operating balance (NOB) is equal to the government’s revenue minus its expenses, excluding expenses related to revaluations (such as the write-down of assets). The NOB is an accrual measure, recognising income when it is earned and expenses when they are incurred, even though the associated cash transactions may occur in different financial years. |
|
Net worth |
Net worth measures the government’s overall wealth, calculated as total assets (both financial and non-financial) less total liabilities at a fixed point in time. Net worth is the broadest measure of the government’s financial position. |
|
Payments |
Payments capture all outgoing cash transactions from the Australian Government to individuals, organisations, or other levels of government. In the budget context, payments are those that affect the underlying cash balance and comprise cash transactions for operating activities and the purchase of non-financial assets. Examples include an Age Pension payment, a Medicare rebate for a doctor's visit, and the wages of a Centrelink employee. |
|
Personal income taxes |
Personal income taxes, referred to as ‘Individuals and other withholding taxes’ in the Budget, are predominantly taxes on salary and wages, but also include tax on other forms of income derived by individuals, including business and investment income, capital gains, and distributions from trusts. |
|
Primary headline cash balance |
The primary headline cash balance adjusts the headline cash balance to exclude interest payments on debt as well as interest receipts. As governments have little control over interest payments in the short term (interest payments are largely determined by the size of previous budget deficits), it can be useful to view this as a budget balance that is largely within the government’s control. |
|
Primary underlying cash balance |
The primary underlying cash balance adjusts the underlying cash balance to exclude interest payments on debt as well as interest receipts. |
|
Receipts |
Receipts are the government's income, recorded at the time they are received as reported on a cash accounting basis. In the budget context, receipts are those that affect the underlying cash balance, so exclude the repayment of loans and other cash flows relating to the exchange of financial assets. Most government receipts are tax receipts, such as company tax, personal income taxes, and goods and services tax. The government also receives non-tax receipts, such as interest earned on government loans and dividends from government investments. |
|
Revenue |
Revenue is government income, recorded at the time it is earned and reported on an accrual accounting basis. Most government income is made up of tax revenue, such as company tax, personal income taxes, and goods and services tax. The government also receives non‑tax revenue, such as interest earned on government loans and dividends from government investments. |
|
Underlying cash balance |
The underlying cash balance is a cash measure of the budget balance equal to the difference between the government's receipts and its payments. It is one of several indicators known as ‘budget aggregates’ that measure the impact of the government's budget on the economy. When the government or the media say the budget is in surplus or deficit, they are generally referring to the underlying cash balance, or sometimes the net operating balance or fiscal balance. More specifically, the underlying cash balance is equal to the government's receipts (for example from tax collections) minus its payments from providing services (such as Medicare) and support (such as the Age Pension). The types of receipts and payments used in the calculation include those from buying and selling non‑financial assets, such as buildings or equipment. The term ‘underlying’ is used because it excludes some cash transactions that are captured in the broader, but less commonly used, headline cash balance. |
[1] Australian Government (2026), 2026-27 Budget, Budget Paper No. 1, Box 3.3: International comparisons of the fiscal position.
[2] Reserve Bank of Australia (2025), Bonds and the Yield Curve | Explainer | Education | RBA.
[3] Federal Reserve Bank of Dallas (2025), Long-term interest rates, (accessed 29 May 2026).
[4] Australian Government (2026), 2026-27 Budget, Budget Paper No. 1, Table 3.5: Reconciliation of general government sector underlying and headline cash balance estimates, 106.
[5] ‘Alternative financing’ mechanisms involve transactions where the cash spent is expected to be paid back later, or even results in an investment return. While these may present short-term pressures on the budget, the long-term impact may be neutral or an improvement. Conversely, the UCB includes transactions not involving any expected future returns to government, and is therefore a better measure of the ongoing cost of the budget.
[6] The alternative financing arrangements, while leaving the initial balance sheet position unchanged, may lead to subsequent revaluations that affect net worth. However, these revaluations, don’t affect net cash flows for policy purposes, as discussed in section 1.5. Concessional loans typically include an impairment of the asset on initial recognition, such that the cash flows do not equal the change in the asset position.
[7] Australian Government (2026), 2026-27 Budget, Budget Paper No. 1, Table 3.5: Reconciliation of general government sector underlying and headline cash balance estimates, 106.
[8] Australian Government (2026), 2026-27 Budget, Budget Paper No. 2, 65, which includes ‘Energy Sovereignty – Fuel Security and Resilience’ which relates to the decisions for the Fuel and Fertiliser Security Facility and Economic Resilience Program.
[9] Australian Government (2026), 2026-27 Budget, Budget Paper No. 2, 72 and 105, which includes the measures ‘Australian Naval Infrastructure Equity Injection’ and ‘Supporting Aviation Priorities’.
[10] Net overseas migration (NOM) measures the net difference between arrivals and departures of those who stay, or are expected to stay, in Australia for 12 months or more within a 16‑month period, regardless of citizenship or visa status. It does not capture the total stock of migrants in Australia, nor does it directly correspond to the Permanent Migration Program.
[11] Migrants on temporary visas can be subject to caps and specific eligibility criteria (for example the Working Holiday Makers (WHM) program).
[12] Australian Government (2025), Centre for Population, 2025 Population Statement, 5.
[13] Australian Government (2026), 2026-27 Budget, Budget Paper No.1, 62 and 78, Budget Paper No. 3, 142.
[14] Australian Government (2026), 2026-27 Budget, Budget Paper No. 3, Part 3: General revenue assistance, 133. The Commonwealth Grants Commission provides independent advice to the Australian Government on how to share GST revenue among the states and territories. For more information refer to https://www.cgc.gov.au/.
[15] Climate Council of Australia (2019), Compound costs: how climate change is damaging Australia's economy.
[16] Deloitte Touche Tohmatsu (DTT) (2024), Independent Review of Commonwealth Disaster Funding, 48-49.
[17] Nixon J. (2019), The Economic Impact of Global Warming: An Oxford Economics White Paper, Oxford Economics.
[18] Climate Change Act 2022 (Cth), subsection 10(1).
[19] A Future Made in Australia Fact Sheet.
[20] Australian Government, CSIRO (2024), State of the Climate 2024.
[21] Disaster Ready Fund | NEMA.
[22] In the 2022-23 October Budget and 2023-24 Budget, this reporting instead referred to ’climate’/’climate-related‘ measures; Further details of the Government’s net zero spending classification can be found on pages 108-112 of 2024-25 Budget, Budget Paper No. 1.
[23] For this scenario, the PBO has accounted for disaster payments relating to past disasters and climate-related expenditure announced up to the 2026-27 Budget already factored into fiscal projections to prevent ‘double counting’.
[24] DTT (2024), Independent Review of Commonwealth Disaster Funding, 48-49.
[25] DTT (2024), Independent Review of Commonwealth Disaster Funding, 48-49.
[26] As there is no provision for the cost of future disasters in the budget, this impact includes both the cost of disasters in line with historical trends, and the growth in these costs due to climate change.
[27] Parkinson, Martin (2026), Independent post-election review of the Parliamentary Budget Office 2025-26, Joint Committee of Public Accounts and Audit, 41.
[28] International Monetary Fund (2026), Australia: Staff Report for the 2025 Article IV Consultation, 19.
[29] Based on the 2026-27 Budget documents for each jurisdiction.
[30] Both MTBO and the government’s Intergenerational report examine the fiscal position over a long time horizon, there are important differences in the methodology and the intention of the analysis. The PBO’s approach is, however, different to the IGR. While the IGR is guided by the question, 'How might government spending evolve under current policy settings?' our scenarios are guided by the question, 'If the government maintains a budget balance broadly in line with historical precedents, is the fiscal position sustainable?' See the PBO’s report Fiscal Sustainability, Box 1, for more information.
[31] For simplicity and due to the availability of historical data, the debt dynamics framework assumes that cash flows for liquidity purposes are zero in the long term, such that liquidity-related inflows and outflows have no long-term impact on debt.
[32] The fiscal sustainability analysis in the 2026-27 Medium-Term Budget Outlook (MTBO) is not comparable with previous editions of MTBO as the scenario time period analysis has been expanded to include the medium term. Previously scenario analysis only commenced at the end of the medium term.
[33] Amounts for the forward estimates period, from 2026-27 to 2029-30, are those presented by the government in the 2026-27 Budget, while amounts for 2030-31 to 2036-37 are projected by the PBO using the same economic assumptions underpinning the Budget (Box 1).
[34] For company tax, the $16.2 billion revenue increase for 2026-27 and 2027-28 is almost entirely offset by a $14.0 billion revenue decrease for 2028-29 and 2029-30, and so the former increase noted as a driver is not visible in Figure 4-5.
[35] On 1 July 2026, increases to the costs of several Visa classes were published, effective from that date.
[36] The PBO’s 2025-26 Budget projections do not include 2036-37, and so cannot be included for this medium-term comparison.
[37] Budget projections over the forward estimates for taxation revenues can be found in Note 3: Taxation revenue by type within 2025-26 Budget Paper No. 1 (291) and 2026-27 Budget Paper No. 1 (382). MYEFO estimates for 2025-26 and 2026-27 can be found in Table 3.11 (79) and Table 3.12 (80) within 2026-27 Budget Paper No. 1.
[38] Analysis based on published 2025-26 and 2026-27 Budget projections, except for 2029-30 where the 2025-26 Budget projection is based on PBO analysis.
[39] While these measures were not separately disclosed in the budget, they have been subsequently identified in the explanatory statement for Home Affairs Legislation Amendment (2026 Measures No. 1) Regulations 2026.
[40] Australian Government (2026), 2026-27 Budget Paper No. 2, Table 1: Receipt measures since the 2025-26 MYEFO, 1-5.
[41] DTBNYA figures are only available for the forward estimates from the Budget. Due to their uncertain nature, the PBO is unable to make projections of DTBNYA over the remainder of the medium term; Figure 4-6 shows values of receipts-related DTBNYA going back to the 2004-05 Budget. Prior to this, DTBNYA was rarely disclosed.
[42] Although bracket creep is generally defined in relation to income tax brackets, other non-indexed elements of the personal income tax system contribute to increasing rates of average effective income tax over time, including income thresholds associated with offsets such as the Low Income Tax Offset (LITO).
[43] In addition to standard personal income taxes, the ‘average personal income tax rate’ incorporates personal income tax-related offsets such as the Low Income Tax Offset (LITO) and Working Australians Tax Offset (WATO), as well as additional personal income tax-related taxes such as the Medicare Levy.
[44] CSIRO (2025), Electric vehicle projections 2025, Appendix Table A.2: Projected electric vehicle fleet share (cars only).
[45] Australian Bureau of Statistics (2026), Household consumption of illicit tobacco and nicotine products, (accessed 3 June 2026).
[46] Australian Government, Australian Institute of Health and Welfare (AIHW) (2026), Alcohol, tobacco & other drugs in Australia. ‘Availability’ refers to the total amount of alcohol, either produced in Australia or imported into Australia, for sale to people living in Australia.
[47] Although the personal income tax base is predominantly salary and wages income (around three-quarters in 2023-24 as per the ATO’s Taxation Statistics 2023-24), the remainder of personal income tax revenue comes from non-salary and wage sources.
[48] The Treasurer, Insiders (season 25, episode 16 2026) [television program], ABC Television, Canberra.
[49] Butler, Mark (2026), Minister Butler speech at the National Press Club, Australian Government.
[50] Since the 2025-26 MTBO, this chart has been revised, reflecting more accurate treatment of workers’ compensation.
[51] Australian Government (2026), 2026-27 Budget, Budget Paper No. 1, Statement 3: Fiscal Strategy and Outlook, 87.
Feedback
If you found this report useful, or have suggestions for improvement, please provide feedback to feedback@pbo.gov.au.
Build your own budget
Our interactive analysis tool allows users to test various policy and parameter changes to see the impact on the Australian Government budget. The modelling in Build your own budget underpins the projections and analysis contained in this report and users can replicate the scenario analysis contained in this report for a more comprehensive view of overall impacts.
Online budget glossary
For more information and details about the terms used in this publication.