Overview
This report provides an aggregated outlook for the national fiscal position. The PBO's National Fiscal Outlook (NFO) consolidates the forecasts from state and territory (state) budgets with the Australian Government’s budget.
The combined 2025‑26 budgets show that the national fiscal outlook has worsened since the last edition of NFO in October 2024, reflecting a deterioration in aggregates across most jurisdictions. This deterioration is despite improved forecast revenue in each jurisdiction, which has been more than offset by increases in forecast expenses. As such, the timeline for achieving a national net operating surplus is no longer in the forward estimates.
The total state net operating balance is forecast to return to surplus in 2027‑28, 2 years later than forecast in the combined 2024‑25 budgets.
National net debt is forecast to steadily increase over the forward estimates from 34.8% of GDP ($1,002 billion) in 2025‑26 to 37.9% of GDP ($1,257 billion) in 2028‑29. Public debt interest payments are forecast to increase, reflecting higher debt levels, tight monetary policy settings and global market conditions.
The PBO's scenario analysis shows a weaker long‑term fiscal sustainability outlook at the national level compared to last year’s report. Nonetheless, in all but 3 scenarios (up from 2), the debt‑to‑GDP ratio is still expected to trend downwards over the 40‑year period. The national fiscal position is likely to remain sustainable provided expense growth falls more into line with that of revenue to return the budget balance to average levels.[1]
Trends in the budget aggregates
Compared to the 2024‑25 NFO, all the main budget aggregates have worsened as a share of GDP at the national level. This reflects a deterioration in these aggregates across most jurisdictions, driven primarily by the Commonwealth and Queensland.
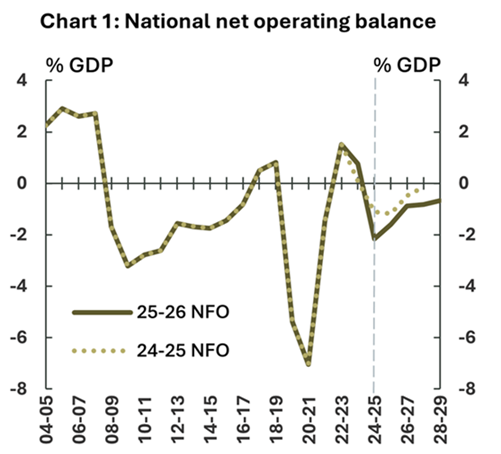
Forecast national net operating balance[2] – the difference between revenue and expenses – has worsened over the forward estimates compared to the previous NFO (Chart 1). The Commonwealth (accounting for around three‑quarters of national revenue and expenses) and Queensland are driving the results. Both revenue and expenses have increased compared to earlier forecasts, but the larger increase in expenses has more than offset the improvements in revenue.
Compared to last year’s forecast of a rapid return to a national net operating surplus, the latest budget forecasts result in continued deficits over the forward estimates.
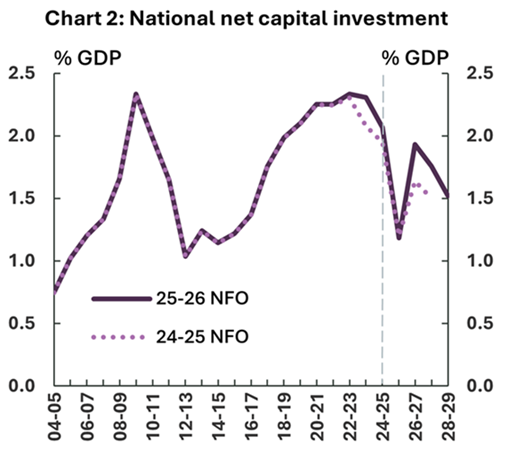
National net capital investment – spending on infrastructure such as roads, schools, and hospitals – was higher than anticipated in 2023‑24 and is expected to be higher over the forward estimates period. This reflects upward revisions in New South Wales, Queensland and the Northern Territory. As a share of GDP, it is expected to decline year‑on‑year (Chart 2).
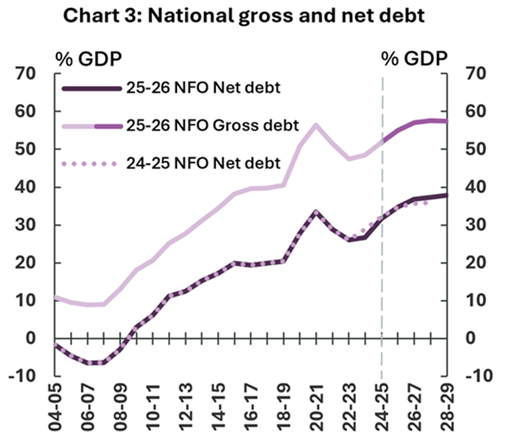
Forecast national net debt[3] has worsened compared to the 2024‑25 NFO. It remains on a slight upwards trajectory but is forecast to moderate by 2027‑28, reaching 37.9% of GDP by 2028‑29 (Chart 3). Commonwealth net debt is around 61% of the total. National public debt interest payments are forecast to increase markedly from 1.7% of GDP in 2025‑26 to 2.1% of GDP in 2028‑29.
National gross debt[4] is expected to continuously increase from 51.9% of GDP in 2024‑25 to 57.5% by 2028‑29 (Chart 3), eclipsing the COVID‑19 high of 56.3% of GDP in 2020‑21. Gross debt is the total amount of government debt before considering a government's financial assets, which partly offset gross debt. Net debt takes certain financial assets into consideration (including cash and deposits, advances paid, and investments).
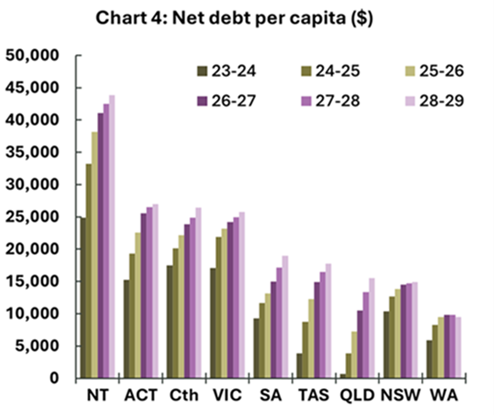
Net debt in most jurisdictions remains at record high levels over the forward estimates and is increasing year-on-year. On a per capita basis the Northern Territory continues to have the highest net debt, while Western Australia and New South Wales are the only jurisdictions to expect net debt to plateau by 2028-29 (Chart 4).
Despite the estimated increases in net debt, the PBO’s fiscal sustainability analysis shows that in most scenarios (24 out of 27 scenarios) the debt-to-GDP ratio is expected to trend downwards over the long term (Box 1).
Box 1: National fiscal sustainability over the long term
The PBO has applied its fiscal sustainability framework to analyse governments' ability to maintain long‑term fiscal policy settings indefinitely, without the need for major remedial policy interventions. If debt‑to‑GDP is declining, it is more likely to be sustainable.
In our fiscal sustainability analysis, we examine 27 scenarios for the consolidated national debt‑to‑GDP ratio over a 40‑year period (see Table A1 for case matrix). Each scenario reflects the range of historical outcomes to project upper, middle, and lower variations from 2028‑29. Variations are made to the consolidated national budget balance (headline cash balance before interest payments), the prior stock of debt and the interest rates that apply to this debt, and economic growth (nominal GDP). The results are shown in the shaded area of Chart 5.
Because each scenario is based on the range of historical outcomes, they implicitly allow for changes in economic conditions, including downturns, and the flexibility for governments to respond, either through automatic or discretionary mechanisms. No specific scenario should be considered as a baseline or most likely trajectory. Instead, we are illustrating what the path could be under a range of economic and policy conditions which are broadly consistent with historical fluctuations. For further methodological details and analysis, please see our Technical Appendix.
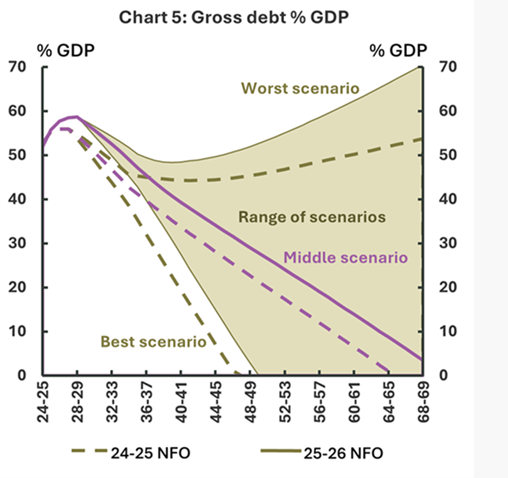
This year’s analysis shows a slightly weaker long‑term sustainability outlook, with the consolidated national debt‑to‑GDP ratio expected to trend downwards, suggesting likely sustainable fiscal positions in all but 3 scenarios (Chart 5). The debt‑to‑GDP ratio at the end of the 40‑year period in the worst scenario is projected to be 5 percentage points higher than projected in the 2024‑25 NFO.
In our middle scenario, the debt‑to‑GDP ratio is projected to trend downwards to reach nil in 2068‑69, 3 years later than previously projected. In our best scenario, the debt‑to‑GDP ratio trends sharply downwards and reaches nil by 2048‑49, one year later than previously projected.
Box 2: State and Territory fiscal trends: Impacts on net operating balance
Over the last 2 decades, the state net operating balance (NOB) has fluctuated, predominantly influenced by the business cycle. Since the early 2000s the NOB has deteriorated on average, with variations within the period, largely driven by steady growth in state expenses from 13.1% of GDP in 2003‑04 to 14.4% of GDP in 2023‑24.
e composition of state expenses has changed over this period (see Chart 6). Health spending has steadily increased as a share of GDP, rising from around 3.3% in 2003‑04 to 4.3% in 2023‑24. Social protection (including disability support and aged care), public order and safety, and housing expenditure have each increased by around 0.2% of GDP, while state education spending declined by around 0.4% of GDP over the same period. Economic affairs remained stable except for a spike during the COVID‑19 pandemic.
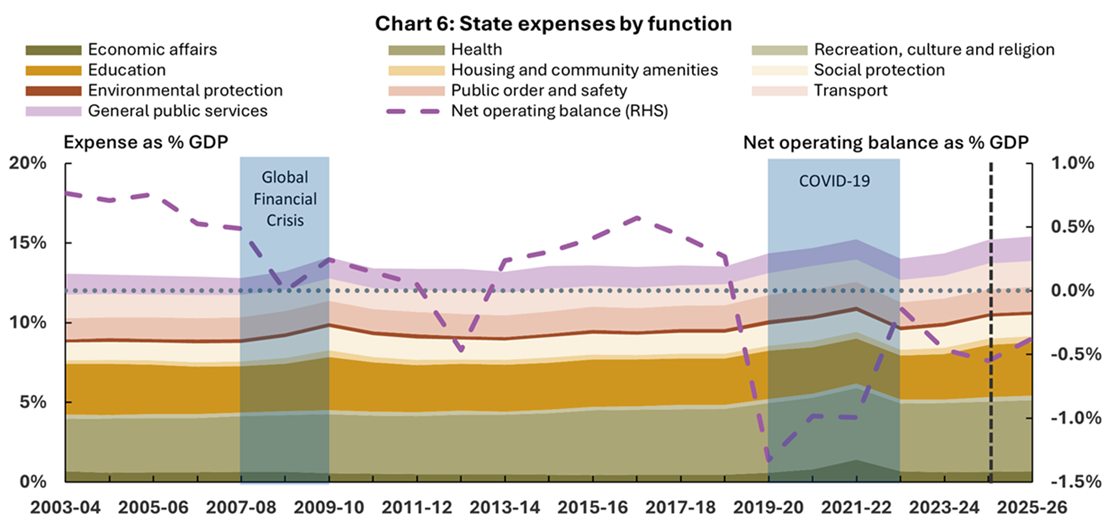
Note: Transfers from the Commonwealth are not included.
Source: PBO modelling based on ABS Government Finance Statistics and state budget papers.
State revenue has shown an overall limited change (13.8% of GDP in 2003‑04 and 13.9% of GDP in 2023‑24) but, like expenses, has experienced a degree of volatility throughout the period. State revenue is closely tied to economic activity – including payroll tax, GST, dividend income and sales of goods and services – as well as Commonwealth payments. Revenues declined in 2008‑09 during the Global Financial Crisis, in 2012‑13 amid a weaker Australian economy and in 2019‑20 and 2020‑21 due to the COVID‑19 pandemic.
Commonwealth expenditure has risen but at a slower rate (24.8% of GDP in 2003‑04 to 25.7% of GDP in 2023‑24) compared to state expenditure. During this period, the largest expense growth has been in health which has increased by 0.4% of GDP. Commonwealth revenue (25.7% of GDP in 2003‑04 and 26.4% of GDP in 2023‑24) continues to have a growing dependence on personal income tax. The composition of indirect taxation has changed, as tariffs and wholesale sales tax have declined or been replaced by a broader based consumption tax (the GST). For more details, see our 2025-26 Medium-term Budget Outlook: Beyond the Budget and Budget Explainer, Australia's Tax Mix.
Our interactive dashboards are best viewed on larger screens/desktops.
Interactive analysis
The below complementary set of interactive charts provides a graphical summary of Commonwealth, state and territory budgets. Change the aggregates, units and budget data source to create customised visualisations.
For further insights, see our Snapshot.
Click here to view the dashboard in the web browser.
Our interactive dashboards are best viewed on larger screens/desktops.
Snapshot
|
National (Commonwealth and states combined) |
States combined |
|
National net operating balance is forecast to improve from a deficit of 1.6% of GDP in 2025‑26 ($46.2 billion) to a deficit of 0.7% of GDP 2028‑29 ($22.2 billion) over the forward estimates. Compared to our previous NFO, forecast national net operating balance has deteriorated by $29.8 billion in 2024‑25 and $21.0 billion in 2027‑28. |
State net operating balance is forecast to improve from a deficit of 0.4% of GDP ($10.8 billion) in 2025‑26 to a surplus of 0.1% of GDP ($4.7 billion) in 2028‑29. Compared to our previous NFO, the forecast state net operating balance has deteriorated by $7.6 billion in 2024‑25 and $3.6 billion in 2027‑28. |
|
National net capital investment is forecast to rise from 1.2% of GDP ($34.1 billion) in 2025‑26 to 1.5% of GDP ($50.5 billion) in 2028‑29. Compared to our previous NFO, forecast national net capital investment has increased – revised up by $3.9 billion in 2024‑25 and $7.6 billion in 2027‑28. |
State net capital investment is forecast to rise from 0.5% of GDP ($13.1 billion) in 2025‑26 to 0.8% of GDP ($26.2 billion) in 2028‑29. Compared to our previous NFO, forecast state net capital investment has increased – revised up by $4.2 billion in 2024‑25 and $6.5 billion in 2027‑28. |
|
National fiscal balance is forecast to improve from a deficit of 2.8% of GDP ($80.3 billion) in 2025‑26 to a deficit of 2.2% of GDP ($72.7 billion) in 2028‑29. Compared to our previous NFO, the forecast national fiscal balance has deteriorated by $33.7 billion in 2024‑25 and $28.6 billion in 2027‑28. |
State fiscal balance is forecast to improve from a deficit of 0.8% of GDP ($23.8 billion) in 2025‑26 to a deficit of 0.6% of GDP ($21.5 billion) in 2028‑29. Compared to our previous NFO, the forecast state fiscal balance deteriorated by $11.8 billion in 2024‑25 and $10.1 billion in 2027‑28. |
|
National revenue is forecast to decline as % of GDP, from 34.6% ($996 billion) in 2025‑26 to 33.9% ($1,124 billion) in 2028‑29. Compared to our previous NFO, forecast national revenue has improved – revised up by $14.7 billion in 2024‑25 and $15.5 billion in 2027‑28. |
State revenue is forecast to decline as a % of GDP, from 15.4% ($442.5 billion) in 2025‑26 to 14.4% ($479.5 billion) in 2028‑29. Compared to our previous NFO, forecast state revenue has improved – revised up by $8.7 billion in 2024‑25 and $19.7 billion in 2027‑28. |
|
National expenses are forecast to decline as % of GDP, from 36.2% ($1,042 billion) in 2025‑26 to 34.5% ($1,146 billion) in 2028‑29. Compared to our previous NFO, forecast national expenses have increased – revised up by $44.5 billion in 2024‑25 and $36.5 billion in 2027‑28. |
State expenses are forecast to fall as % of GDP, from 15.7% ($453.3 billion) in 2025‑26 to 14.3% ($474.8 billion) in 2028‑29. Compared to our previous NFO, forecast state expenses have increased – revised up by $16.3 billion in 2024‑25 and by $23.3 billion in 2027‑28. |
|
National net debt is forecast to increase from 34.8% of GDP ($1,002 billion) in 2025‑26 to 37.9% of GDP ($1,257 billion) in 2028‑29. Compared to our previous NFO, forecast national net debt has deteriorated by $3.9 billion in 2024‑25 and improved by $29.7 billion in 2027‑28. |
State net debt is forecast to increase from 14.3% of GDP ($412.1 billion) in 2025‑26 to 15.8% of GDP ($524.3 billion) in 2028‑29. Compared to our previous NFO, forecast state net debt was mixed, deteriorating by $7.2 billion in 2024‑25 and revised up by $13.6 billion in 2027‑28. |
|
National gross debt is forecast to increase from 55.1% of GDP ($1,585.7 billion) in 2025‑26 to 57.5% of GDP ($1,910.1 billion) in 2028‑29. Gross debt was not included in the 2024‑25 NFO and so we have not included a comparison to the previous NFO. |
State gross debt is forecast to increase from 20.6% of GDP ($593.7 billion) in 2025‑26 to 21.8% of GDP ($722.4 billion) in 2028‑29. Gross debt was not included in the 2024‑25 NFO and so we have not included a comparison to the previous NFO. |
|
National public debt interest payments are forecast to increase from 1.7% of GDP ($48.1 billion) in 2025‑26 to 2.1% of GDP ($68.9 billion) in 2028‑29. Compared to our previous NFO, forecast national public debt interest payments have been revised up by $1 billion in 2024‑25 and $3.2 billion in 2027‑28. |
State public debt interest payments are forecast to increase from 0.7% of GDP ($20.3 billion) in 2025‑26 to 0.9% of GDP ($30.7 billion) in 2028‑29. Compared to our previous NFO, forecast state public debt interest payments – revised up by $0.4 billion in 2024‑25 and $2.1 billion in 2027‑28. |
Appendix
Table A1: Cases for middle, best and worst scenarios
|
Cases |
Interest rates |
Nominal GDP |
Consolidated national budget balance |
|
Downside |
Interest rates rise to 5.2% by 2068‑69 |
Nominal GDP growth reaches 3.5% by 2068‑69 |
A sustained minor surplus is maintained from 2030-31 through to 2068‑69 |
|
Middle |
Interest rates rise to 4.4% by 2068‑69 |
Nominal GDP growth reaches 4.4% by 2068‑69 |
A sustained modest surplus is maintained from 2029‑30 through to 2068‑69 |
|
Upside |
Interest rates rise to 3.5% by 2068‑69 |
Nominal GDP growth reaches 5.2% by 2068‑69 |
A sustained stronger surplus is maintained from 2028‑29 through to 2068‑69 |
Footnotes
The contents of this report are the sole responsibility of the Parliamentary Budget Office.
[1] More discussion on Commonwealth fiscal sustainability and risks is contained in 2025-26 Medium-term Budget Outlook: Beyond the Budget.
[2] The net operating balance (NOB) and net capital investment (NCI) are presented separately in this report. The NOB is revenue less expenses and the NCI is the change in non-financial assets. NOB provides the best indication of recurrent spending while NCI provides the best indication of infrequent purchases and sales of assets. The fiscal balance combines the two measures. States do not report the underlying cash balance. See the technical appendix for further information.
[3] Net debt figures for Queensland are inclusive of investments set aside for superannuation purposes.
[4] There is a structural break between historical data and forecasts for gross debt. See note 7 in the data pack for details.
The technical appendix and data pack provides further information on the data sources and method used in this report.
Additional data to those cited in this report is available on our data portal.