Overview
This Costing Concept explains how the Parliamentary Budget Office (PBO) models the financial impact on the Budget of policy changes that affect prices in the nicotine market, including excise and Goods and Services Tax (GST) revenue.
The PBO does not undertake predictions of what will occur in this market. The PBO regularly reviews and updates our assumptions when new evidence comes to light, which may not be reflected in this costing concept.
Approach
For policy costings involving changes to the level of excise applied, the PBO model focusses on consumers including how they may:
- change what type of nicotine product they primarily use; and/or
- change how much of that product they consume.
Impacts on manufacturers, retailers or illegal market operators are generally assumed to be minimal in response to a policy change, beyond any passthrough on price. Second round effects, such as the impact of manufacturers exiting the market or any changes to trade through illegal channels, are not considered.
Market structure
PBO separates the nicotine market into 4 core product groups: factory made cigarettes, looseleaf tobacco, reusable e-cigarettes, and disposable e-cigarettes. Each group has legal and illegal sales channels for a total of 8 product types.
For costing purposes, the PBO assumes that where relative pricing of the different products changes, consumers will substitute between products but the number of consumers in the market remains relatively stable (See Key assumptions).
Key assumptions
The PBO makes the following assumptions when costing policies affecting prices of nicotine products.
Consumption
- Approximately 17% of Australians would regularly consume nicotine products. The number of consumers is assumed to be steady at this level over the medium term, owing to the range of substitutes and established illegal market.
- 17% usage reflects the average reported over 2014 and 2024 through the Roy Morgan The full picture: a decade of smoking in Australia publication.
- The typical smoker would consume approximately 13 cigarettes per day, per the Australian Institute of Health and Welfare (AIHW) 2025 Alcohol, tobacco & other drugs in Australia publication.
- The typical roll-your-own cigarette would contain approximately 0.6 grams of looseleaf tobacco. Using the 'equivalisation rate' for per-kilogram tobacco products, this would equate to over 2,800 grams of looseleaf tobacco per year.
- The typical e-cigarette user would consume approximately 4.0 ml of e-liquid per day, informed by the Australian Tobacco Harm Reduction Association and JAMA Internal Medicine. This is equivalent to around 1,460 ml of e-liquid per year, or 58 disposable 25 ml vapes.
- Average consumption of nicotine products are summarised in Table 1.
Prices of nicotine products
- Legal tobacco prices are based on average retail prices reported by Cancer Council Victoria via Tobacco in Australia, minus excise and GST. Illegal tobacco products are priced at approximately 30% of the retail price of legal equivalent products (including taxes and excise), based on media reporting.
- E-liquid prices for e-cigarettes are based on the price of a sample of products for sale on New Zealand vape websites. The price of e-liquid sold through illegal market channels in Australia is assumed to be similar, due to a lack of local data.
- The cost of all products before excise or other taxes are applied (where relevant) would grow in line with CPI over the medium term.
- Manufacturers or retailers would pass on 100% of excise changes to consumers.
- Average prices of nicotine products are summarised in Table 1 below.
Table 1: Consumption and price assumptions summary (2024-25)(a)(b)
| Product |
Class |
Base price per unit |
Tax per unit |
Consumption per year |
Retail cost per year(a) |
|---|---|---|---|---|---|
| Factory made cigarettes |
Legal |
$0.57 per stick |
$1.56 per stick |
4,745 sticks |
$10,106 |
| Factory made cigarettes |
Illeagal |
$0.64 per stick |
- |
4,745 sticks |
$3,032 |
| Looseleaf tobacco |
Legal |
$0.63 per gram |
$2.36 per gram |
2,847 grams |
$8,512 |
| Looseleaf tobacco |
Illeagal |
$0.90 per gram |
- |
2,847 grams |
$2,553 |
| Reusable e-cigarettes |
Illeagal |
$1.44 per ml |
- |
1,460 ml |
$2,109 |
| Disposable e-cigarettes |
Illeagal |
$35 per device |
- |
58 devices |
$2,044 |
(a) The annual retail cost is calculated as the total price per unit of product (base price plus tax) multiplied by consumer consumption.
(b) Legal vaping products (reusable and disposable e-cigarettes) are not included in Table 1 as they would not be affected.
Consumer behaviour
- Where a policy change results in the price of a nicotine substitute product becoming 50% more expensive than the current product, consumers would no longer consider substituting to that product due to the price difference. For close substitutes, a portion of consumers (25%) would still consider that substitute product.
- After the substitution limit above is considered, where a policy change results in the price of a nicotine product relative to other products changing, consumers will substitute with price elasticities outlined in Table 2.
Table 2: Assumed price elasticity between product groups
| Product |
Factory made cigarettes |
Looseleaf tobacco |
Disposable e-cigarettes |
Reusable e-cigarettes |
|---|---|---|---|---|
| Factory made cigarettes |
-1.477 |
0.5 |
0.149 |
0.149 |
| Looseleaf tobacco |
0.5 |
-1.417 |
- |
- |
| Disposable e-cigarettes |
0.149 |
- |
-1.363 |
0.5 |
| Reusable e-cigarettes |
0.149 |
- |
0.5 |
-1.560 |
-
Own and cross price elasticities were sourced from a 2018 analysis of US tobacco and nicotine replacement products, with adjustments to reflect strong demographic/preference differences between the markets.
-
Consumers would substitute between legal and illegal markets at an elasticity of 1, to reflect that both legal and illegal markets are well established with comparable product offerings.
-
Consumers who switch products would take 2 years to switch. Where a consumer does not switch, they would adjust their consumption of their current product immediately.
Market mix
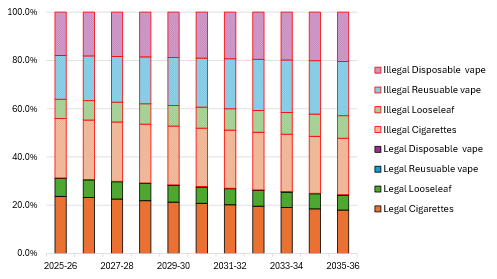
- Based on the assumptions detailed above, PBO assumes a baseline market mix over the medium term shown in Figure 1.
Figure 1: Assumed baseline market mix (as at March 2026)
Tax and implementation
- 11/12 of GST is collected within the same financial year, with the remainder received in the following financial year. Payments to states and territories occur following receipt of GST by the Commonwealth.
- Departmental expenses associated with changes in nicotine taxes are not expected to be significant and funded from within existing departmental resourcing.
Methodology
The PBO calculates excise and GST collection using the following steps:
- Prices are calculated to reflect the baseline and policy change.
- The market mix is estimated based on prices and the price elasticities outlined in Key assumptions above.
- Average per-capita consumption of each product are estimated using own-price elasticities of each product.
- Total consumption is estimated by multiplying the number of consumers for each product by the average per-capita consumption of that product.
- Total excise and GST are estimated using the updated consumption and rates for each product type for the baseline and policy change.
The estimated financial impact is estimated by multiplying the percentage change in excise and GST between the PBO calculated baseline and policy change by the most recent budget estimates for excise and GST.