Budget aggregates
Figure 1: Underlying cash balance (UCB)
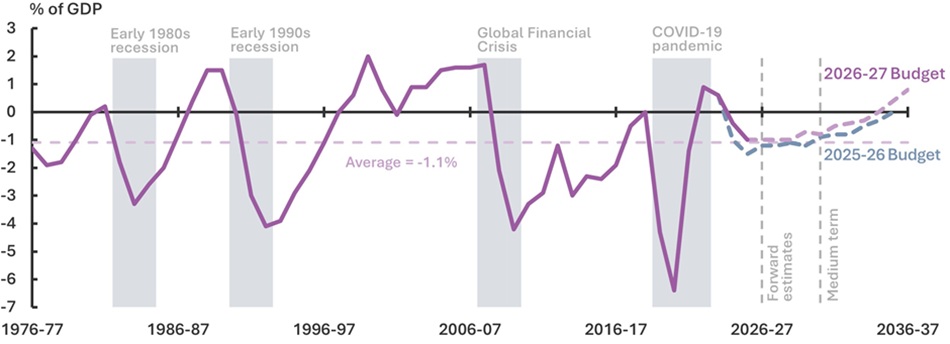
The Budget is $44.9b stronger since MYEFO
- Since MYEFO, forecast UCB has improved by $44.9b over the forward estimates and is now projected to return to balance in 2034-35. The improved outlook is underpinned by $36b of savings from NDIS over the forward estimates.
- Historically, significant deficits triggered by major economic shocks have typically been followed by periods of fiscal repair.
Figure 2: Gross debt
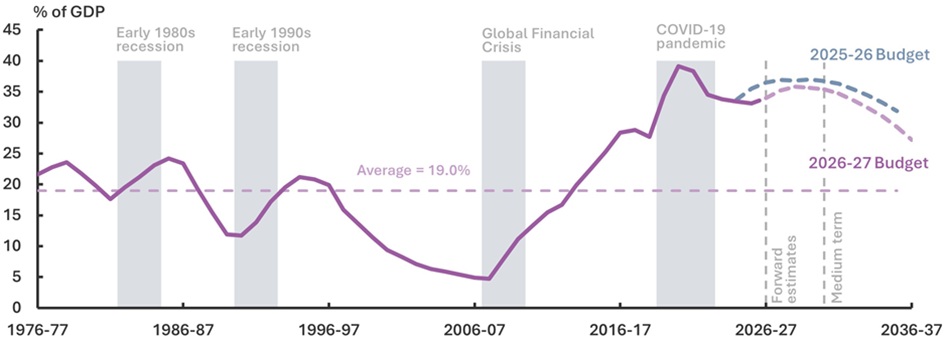
Debt to reach 35.8% of GDP in 2028-29
- Gross debt is expected to reach $1.1 trillion during 2027-28 (equivalent to around $37,000 per person). During 2029-30, gross debt is forecast to exceed the $1.2 trillion maximum value of Government debt set by the Treasurer.
- Gross debt as a share of GDP is projected to peak lower and later than at last Budget at 35.8% in 2028-29, before falling to 27.2% by 2036–37.
Figure 3: Change in UCB estimates between the 2025-26 and 2026-27 Budgets
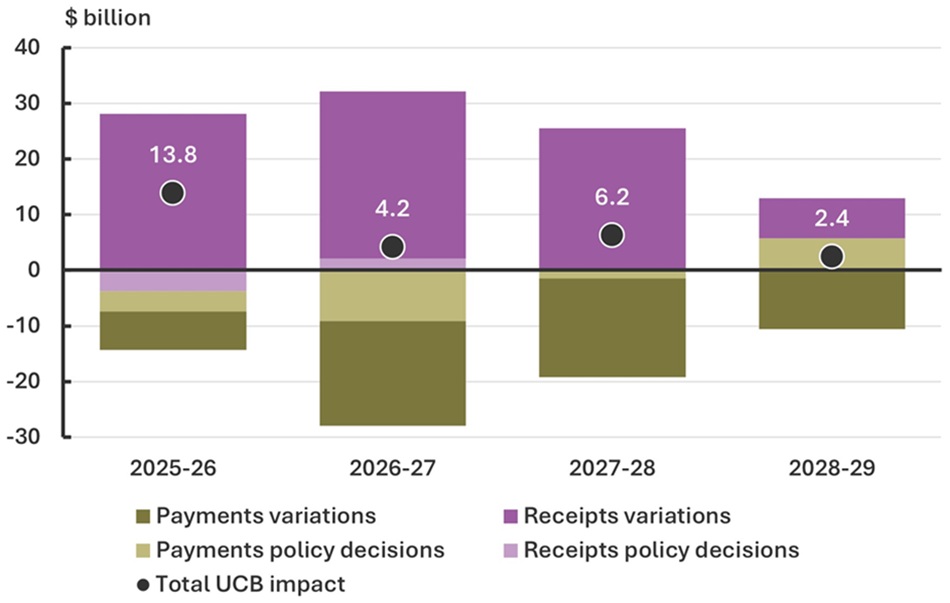
$26.7 billion improvement to the UCB over 4 years
- Since last Budget, the change in UCB estimates is driven primarily by variations. The largest variations are higher income tax receipts and higher spending on the NDIS, GST payments to the states.
Figure 4: Change in UCB estimates from the previous fiscal update
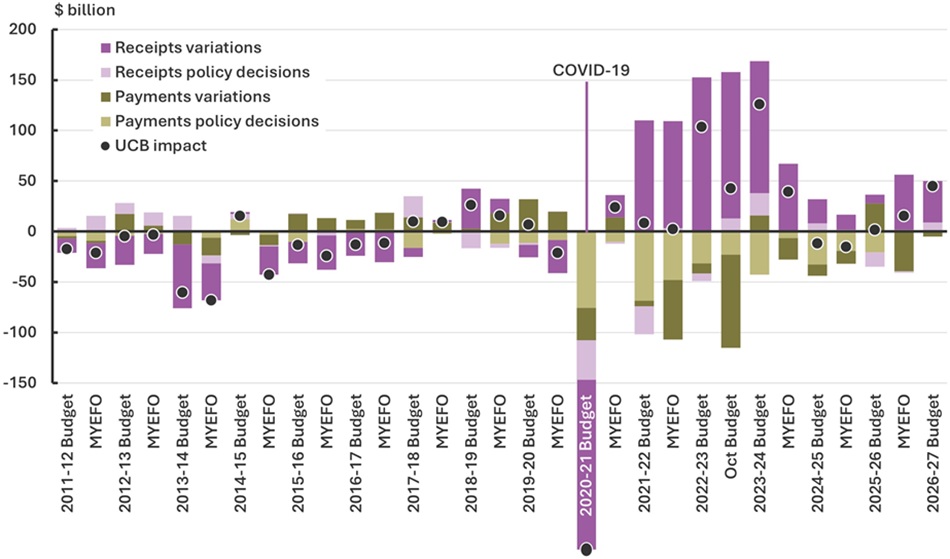
- Large receipts variations in the first 2 forecast years are partly unwound by 2029-30. Conversely, policy decisions weaken the UCB in the first 2 years but benefit the budget in the later years.
Figure 5: Change to nominal GDP forecasts between the 2025-26 and 2026-27 Budgets
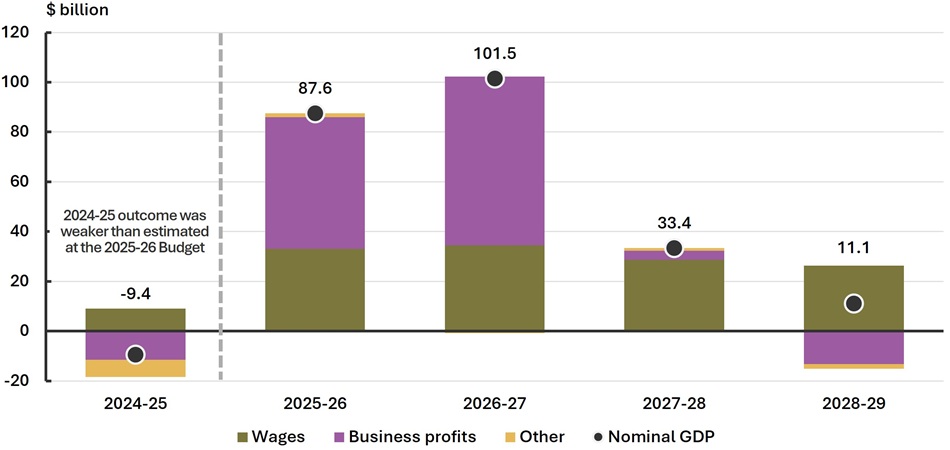
Nominal GDP is forecast to be much higher than expected a year ago
- The stronger outlook for nominal GDP compared to last year’s Budget is driven primarily by stronger wages and business income, particularly for this year and next year.
Figure 6: Change to taxation receipts forecasts between the 2025-26 and 2026-27 Budgets
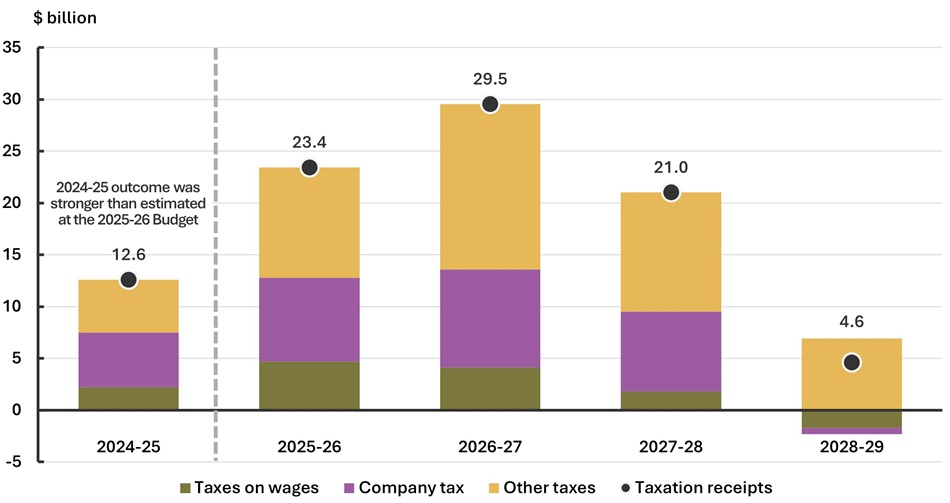
Stronger nominal GDP means stronger tax receipts
- The stronger outlook for nominal GDP translates to broad upgrades to tax receipts.
- The largest improvements are for taxes on companies (the purple bars), as well as unincorporated business and investment earnings of individuals and super funds (the yellow bars).
Programs and measures
Figure 7: Largest measures over the forward estimates
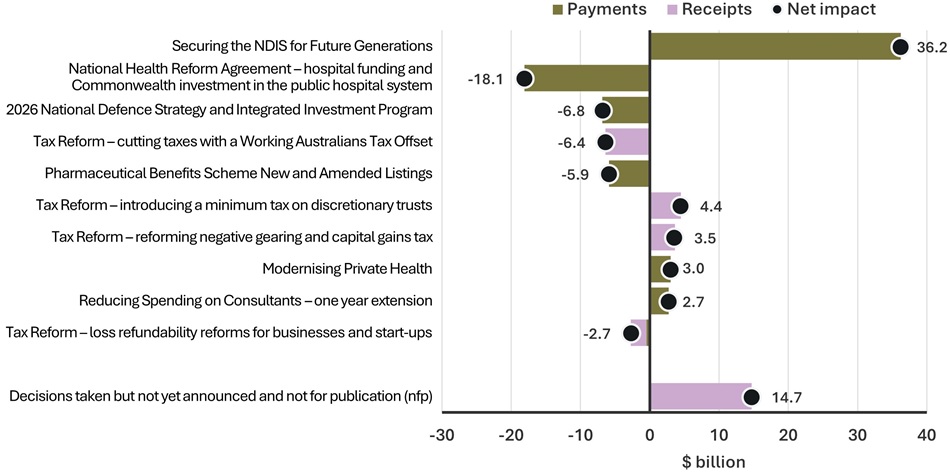
137 measures in the 2026-27 Budget
- The largest 10 measures improve the UCB by around $9.9b.
- Securing the NDIS for Future Generations has the largest policy impact and is expected to improve the budget by around $36.2b, while additional funding to public hospitals and 2026 National Defence Strategy and Integrated Investment Program would reduce the UCB by $18.1b and $6.8b respectively.
Figure 8: Total payments and receipts
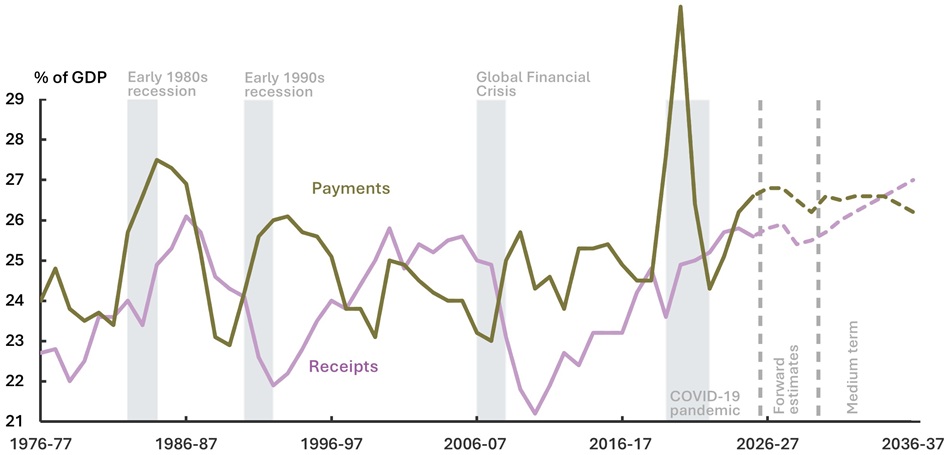
Payments-receipts gap projected to close
- Payments are projected to be lower than receipts by 2034-35.
- Payments are expected to rise in the next 2 years, but decline back to current levels (26.2%) by the end of the forward estimates.
- Receipts as a share of GDP are expected to increase from 25.5% in 2029-30 to 27.0% in 2036-37.
Figure 9: Average annual growth in major payments over the medium term
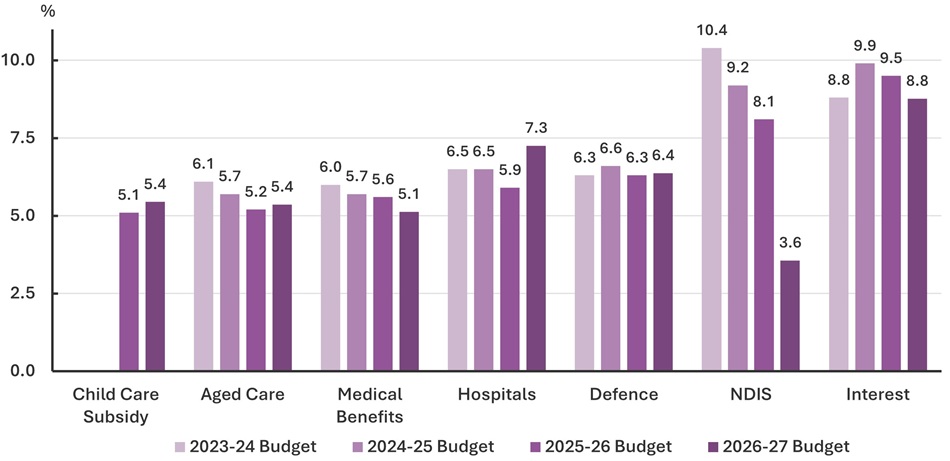
- Public debt interest payments remain the fastest growing over the medium term, while growth in NDIS is expected to slow reflecting budget policy decisions.
- Growth in other major payments is expected to remain relatively stable.
Expenses and revenue
Figure 11: Selected expenses 2013-14 to 2029-30
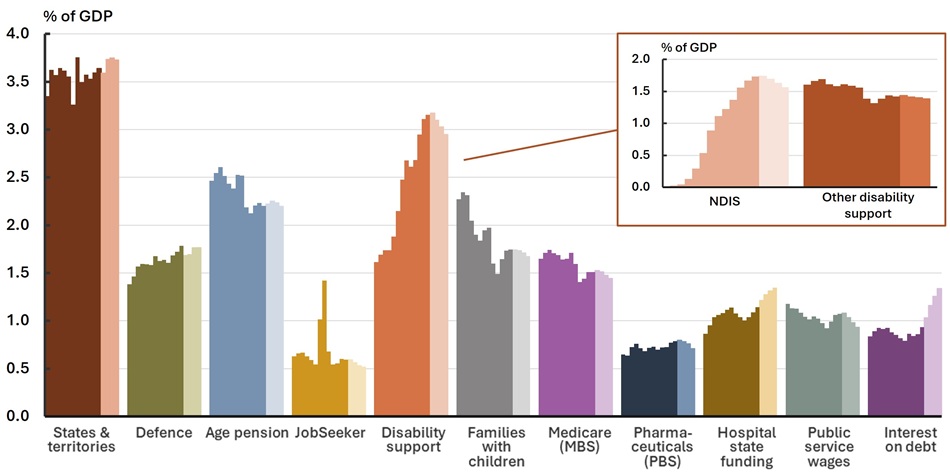
- Payments to the states & territories – primarily GST payments – remain the largest expense.
- NDIS expenses have been the fastest growing expense, with growth in participant plan expenses averaging 21% per annum over the 5 years to 2024-25, this reduces to 3% per year over the forward estimates.
- Assistance to families with children and public service wages have declined as a share of GDP, and this trend is projected to continue.
Figure 12: Tax revenue 2013-14 to 2029-30
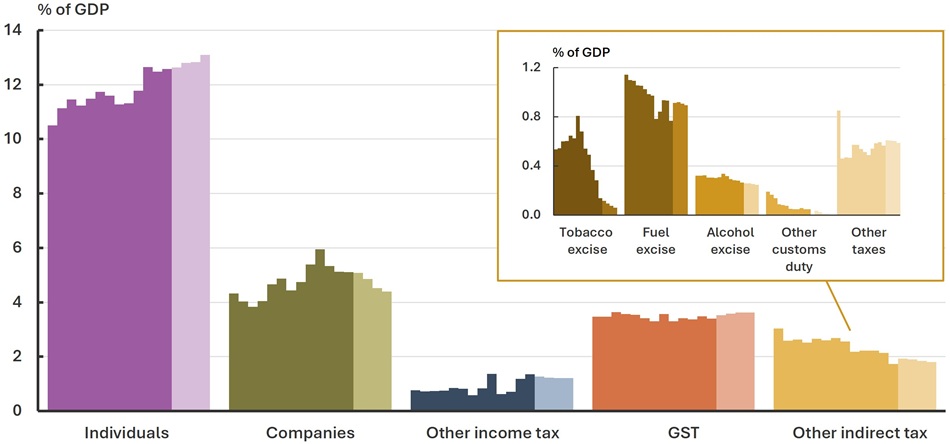
- Other than personal income tax, all tax bases are projected to be flat or declining as a share of GDP over the forward estimates, with tobacco excise continuing its recent sharp decline.
Key terms and notes
For the 2026-27 Budget, the forward estimates period is from 2026-27 to 2029-30, and the medium term is to 2036-27.
Learn more about key terms in the PBOs online budget glossary and use the 2026-27 Guide to the Budget to learn how to navigate the budget papers.
Figure 2
The Australian Government borrows mainly by issuing Australian Government Securities (government bonds). Under the Commonwealth Inscribed Stock Act 1911, the Treasurer is required to set a direction – which is a non-disallowable legislative instrument – as to the maximum amount of Commonwealth debt that can be on issue. The current instrument sets this limit at $1.2 trillion.
Figures 3 and 4
Parameters are elements that affect the price, cost, or amount of government activities. Payments and receipts variations may arise from parameter changes linked to the economic outlook, such as employment, prices and wages, as well as program‑related demographic factors, including changes in recipient populations.
Figure 3 does not include the final year of the forward estimates (2029-30) as the previous Budget does not include a baseline comparator.
Upwards revisions to spending on the NDIS are forecast to be more than offset by the 2026-27 Budget measure, Securing the National Disability Insurance Scheme for Future Generations.
Figure 4 captures the total UCB change over the full forward estimates period at each fiscal update.
Figure 5
Wages is the compensation of employees (COE), and the business income are the sum of gross operating surplus (GOS) and gross mixed income (GMI).
The values were derived using the growth forecasts reported in Table 5.4 in Budget Paper No. 1.
Figure 5 does not include the final year of the forward estimates (2029-30) as the previous Budget does not include a baseline comparator.
Figure 6
Taxes on wages refers to gross income tax withholding.
Other taxes includes all taxes other than taxes on wages and company tax, such as taxes on unincorporated business income, capital gains, superannuation, GST, and excise.
Changes to tax receipt forecasts shown also include the impact of new policy decisions.
Figure 6 does not include the final year of the forward estimates (2029-30) as the previous Budget does not include a baseline comparator.
Figure 7
Measures are ordered by the absolute size of their total fiscal impact.
Decisions taken but not yet announced (DTBNYA) covers expenditure and non-tax revenue decisions that have been included in the budget aggregates but not yet announced, as well as policies that have been announced but whose costs cannot be disclosed.
Figure 9
Interest refers to interest payments on Australian Government Securities.
NDIS refers to the Australian Government’s contribution to payments for NDIS participant supports.
Average annual growth is calculated over the medium‑term period applicable to each Budget.
Growth over the medium term in the Child Care Subsidy was not shown in the 2023-24 or 2024-25 Budgets.
Figure 11
The States and territories expense relates to general revenue assistance, largely comprised of payments of GST entitlements.
Other disability support primarily includes financial support for people with disability and carers, other than NDIS expenses.
The chart shows participant plan expenses for the NDIS. See Table 3.1 of the NDIA Portfolio Budget Statement.
Families with children refers to Assistance to families with children.
Figure 12
Other customs duty is customs duty excluding that related to fuel, alcohol and tobacco excise.
Other taxes captures all other indirect taxation revenue such as the wine equalisation tax and the major bank levy.