This is an introductory guide to the 2026-27 Budget Papers. For additional resources:
- see our Online Budget Glossary for more detail on key terms related to the Budget
- read our Overview of the Budget Process - this fact sheet outlines the main components and timing of the annual budget cycle.
The Budget Papers
The Budget is presented in 4 books, called Budget Papers, plus supporting documents. The Budget can be found at budget.gov.au.
The budget papers change little from year to year, so familiarising yourself with last year's budget is a great way to prepare for the next budget.
Budget Paper No. 1: Budget Strategy and Outlook
Budget Paper No.1 (BP1) provides high-level information about the fiscal position and the overall economic outlook, including:
- the international and domestic economic outlook
- the budget and fiscal outlook, including estimates of the budget balance, revenue, expenditure, and investment
- how the fiscal outlook has changed since the previous fiscal and economic update
- the balance sheet position, including assets, liabilities, and debt
Statement 1 of BP1 provides an overview, with detail in the following 10 statements. Historical Australian Government Data is included in Statement 11.
Budget Paper No. 2: Budget Measures
Budget Paper No. 2 (BP2) contains details of policy decisions (measures) taken since the last update. Each measure is classified according to whether it impacts receipts or payments. BP2 includes a summary table and a detailed description of each individual measure.
Budget Paper No. 3: Federal Financial Relations
Budget Paper No. 3 (BP3) contains information on payments made by the Government to the states and territories (including GST).
Budget Paper No. 4: Agency Resourcing
Budget Paper No. 4 (BP4) contains information on the funding and the Average Staff Level (ASL) for each government agency.
Portfolio Budget Statements
The Portfolio Budget Statements (PBS) contain more detail on the proposed activities, expenditures, and performance of each agency within each portfolio. This includes details on outcomes and programs by each entity.
Budget overview ‘glossy’ and fact sheets
The Budget 'glossy' and fact sheets highlight key aspects of the budget in a more accessible format.
Mid-Year Economic and Fiscal Outlook (MYEFO)
The MYEFO provides an update on the budget position and economic outlook, typically released between October and December. MYEFO is the main point of comparison for the Budget, with the most recent release being the 2025-26 MYEFO published 18 December 2024.
Economic forecasts
The economic forecasts underpin the estimates for taxes and spending.
Statement 1 of BP1 provides high-level information about the overall economic outlook, including a summary of the key items in Table 1.1 (these items form part of the ‘economic parameters’).
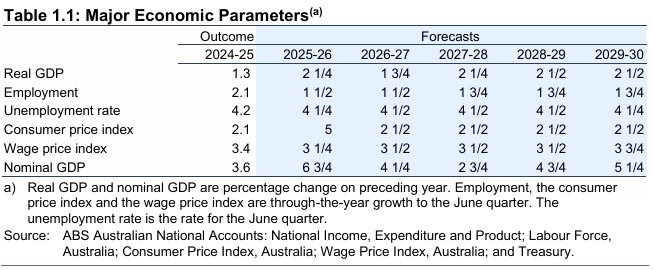 Source: BP1, Statement 1: Budget Overview, page 7
Economic growth
Gross domestic product (GDP) is a measure of the size of the economy. GDP growth forecasts show expectations of how much economic activity is expected to expand or contract in each year.
- Nominal GDP measures the total value of goods and services produced. Many budget amounts are presented as a share of nominal GDP, which can assist with making meaningful comparisons over time.
- Real GDP growth removes the effect of price changes, or inflation, over time to measure the change in the volume of goods and services produced. Growth in real GDP is one of the most used measures for the health of the economy.
Employment
Employment measures the percentage change in the number of people who have a job. The unemployment rate is the percentage of the labour force who are not employed.
Inflation
Inflation is the rate of increase in prices over time. A common measure of inflation is the consumer price index (CPI), which captures the change over time in the prices paid by households for a fixed basket of goods and services.
The wage price index (WPI) measures the average change in wages, irrespective of the type or amount of work performed.

Tip: Have the last Budget nearby so you can compare the economic forecasts. Previous budgets can be found in the Budget Archive.
Do you need more information? Statement 2 of Budget Paper 1 contains more detail on the economic outlook.
The budget balances
There are many aggregate estimates in the Budget. When people talk about the budget surplus or deficit, they are usually talking about the underlying cash balance.
BP1 provides high-level information about the budget position. The forecast budget balance is shown in Table 1.2. More detail on the aggregates is in Statement 3: Fiscal Strategy and Outlook.
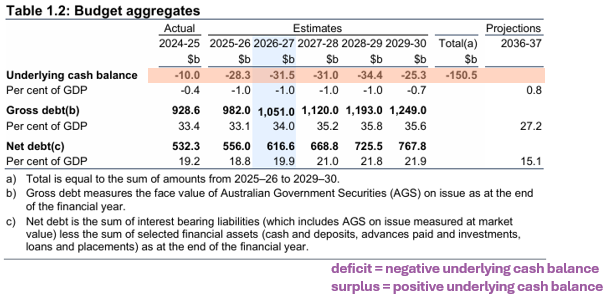
Source: BP1, Statement 1: Budget Overview, page 8
What is a budget surplus?
- The budget is in surplus when the Government's receipts are greater than its payments.
- The budget is in deficit when the Government's payments are greater than its receipts.
Cash accounting and accrual accounting
Many figures in the Budget are shown both on a cash accounting basis and an accrual accounting basis. The underlying cash balance is a cash estimate while the fiscal balance (Table 3.7) is an accrual estimate. Differences between them are often because of timing:
- Cash accounting recognises income and expenses when money changes hands.
- Accrual accounting records income when it is earned, and costs when they are incurred, regardless of when the related cash is received or paid. Accrual figures give information about money that will need to change hands in the future if it has not done so already.
The Government and media usually quote the cash figures for the budget balance. The underlying cash balance is broadly equal to receipts less payments. The fiscal balance is an accrual measure that equals revenue less expenses plus net capital investment.
Do you need more information?
Detailed information can be found on:
• Fiscal strategy and outlook: Statement 3 of Budget Paper 1
• Revenue estimates: Statement 5 of Budget Paper 1
• Expenses and net capital investment: Statement 6 of Budget Paper 1.
What has changed since MYEFO?
The Budget refers to the fiscal forecasts as ‘estimates’, which are revised between fiscal updates due to either new policy decisions or variations to economic and other parameters.
The most recent fiscal update before this Budget was the MYEFO in December 2025. It updated the 2025-26 Budget estimates.
What are parameter variations, and how are they different to policy decisions?
- The effect of policy decisions represents the changes to government finances that arise because of government decisions (measures). They can be new policy or changes to existing policy.
- Parameter and other variations are any changes to government finances that are not due to a policy decision. These are generally outside the direct control of the government. Parameter variations mostly occur because of changes in the broader Australian economy, including changes to the composition or demographics of the Australian population.
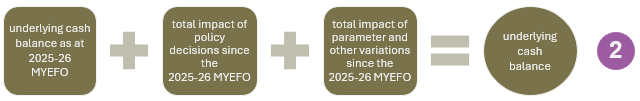
The policy decisions and parameter variations sum to the total change in the budget position.
Where is information on how the estimates have changed?
BP1, Statement 3: Fiscal Strategy and Outlook, includes a table known as the reconciliation table (shown below). It reconciles estimates from the previous budget with the current estimates. It is a helpful summary of the Budget as it shows what has driven the change in the estimates from one update to the next.
The reconciliation table steps through how the underlying cash balance estimates have changed over the past year. For the 2026-27 Budget, the starting point for the reconciliation was the 2025-26 Budget, through the 2025-26 MYEFO, to the 2026‑27 Budget.
The table includes information on how the estimated actual for the current year has changed, as well as the forward estimates years.
How to calculate the effect of policy decisions and parameter variations
Each of these effects can be broken down by which aspect of the government’s finances they affect.
-
An increase in receipts has a positive effect on the budget balance.
-
An increase in payments has a negative effect on the budget balance.
The total effect of policy decisions or parameter variations is:
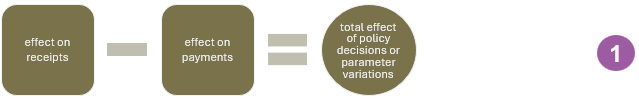
The total change in the budget balance for the 2026-27 Budget is:
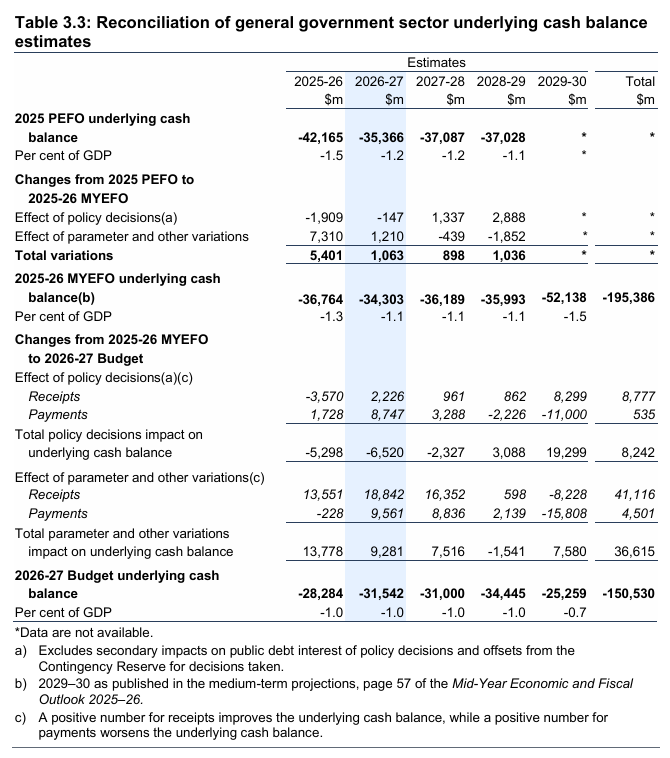
Source: BP1, Statement 3: Fiscal Strategy and Outlook, page 95

Do you need more information?
Detail on the reconciliation of estimates related to:
- Payments can be found in Table 3.4 of Statement 3 in Budget Paper 1, and expenses in Table 6.1.2 of Statement 6 of Budget Paper 1 – these tables show the detail of economic and other parameter variations.
- Receipts can be found in Table 5.2 and revenue in Table 5.8 of Statement 5 of Budget Paper 1.
- A reconciliation of the fiscal balance, which is on an accrual basis, is available in Table 3.8 of Statement 3 of Budget Paper 1.
New measures
A ‘measure’ is a policy decision or action the Government has decided to take, including an amendment to an existing policy.
Where can I find information on new measures?
BP2 includes details of every measure undertaken since the last update – the 2025-26 MYEFO. It includes a summary table and details on each individual measure, including:
- a description of the measure
- the projected costs or income associated with the measure
The measures listed in BP2 are split into 2 sections: receipts and payments (excerpts of the summary tables are shown below).
How do I interpret the numbers?
The numbers in the table represent the impact of the policy within the portfolio each year across the forward estimates.
- A positive number for a receipts measure means the government has more money flowing in (and vice versa).
- A positive number for a payments measure means the government is spending more (and vice versa).
How do I find a particular measure?
Measures are listed under the relevant policy portfolio, according to the department responsible for implementing the measure.
Note:
- If more than one department is involved, the same measure may appear under multiple portfolios in the table.
- If a topic does not clearly align with ministerial responsibilities, then you may need to look across multiple portfolios to find a measure.
For example, most indigenous-specific measures are listed under the Prime Minister and Cabinet portfolio, which includes the National Indigenous Australians Agency. However, there may also be measures listed under other portfolios, such as Health, which include indigenous-specific funding. - Look for relevant terms in the budget measure title or description to find any relevant measures.
- Also, check the relevant Portfolio Budget Statement (PBS) for more information.
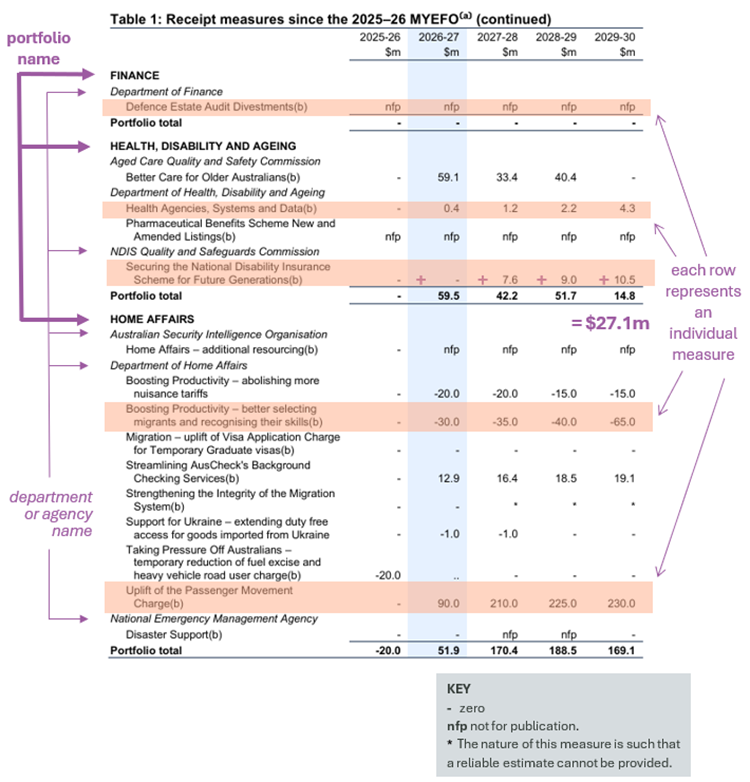
Source: BP2, Part 1: Receipt Measures page 2
Note: A positive number for receipts improves the underlying cash balance, while a positive number for payments worsens the underlying cash balance.
Do you need more information?
Detailed information on each measure listed in the table can be found directly after the summary table in Budget Paper 2.
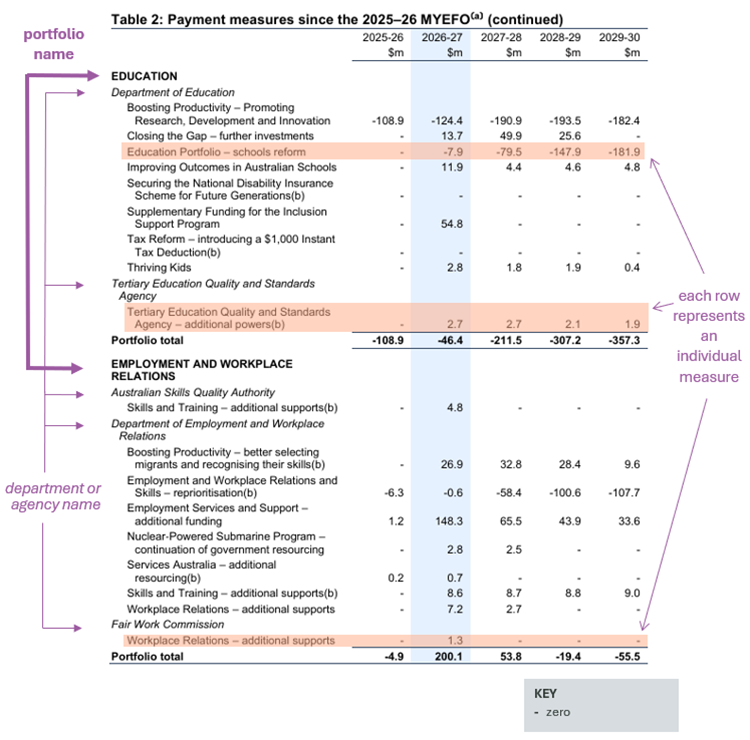
Source: BP2, Part 2: Payment Measures page 27.
Note: A positive number for receipts improves the underlying cash balance, while a positive number for payments worsens the underlying cash balance.
New measures in detail
Further details of each measure can be found directly after the summary tables in BP2.
Each measure includes a description of the measure and additional information on funding sources. If the measure is split across several portfolios, they will all be listed under the detailed measure description.
An example of a measure from the 2026-27 Budget is below. Note that figures may not sum due to rounding.
Health, Disability and Ageing
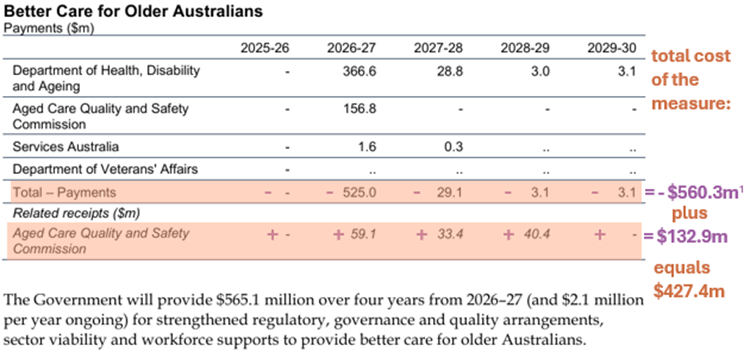
Source: BP2, Part 2: Payment Measures, page 94
Note 1: Due to rounding, the calculated payment differs from the value reported in the text. A positive number for receipts improves the underlying cash balance, while a positive number for payments worsens the underlying cash balance
How do I calculate the total impact of a measure?
The previous table presents the impact of a measure on a cash basis in each year of the forward estimates. Add together the impact in each year to get the total impact of the measure.
Check the description of the measure to find out if the policy is terminating or ongoing.
-
If the impact of a measure is nil in the final year, the policy may be ending.
-
If a measure has an impact in the final year, the policy may continue beyond the years shown.
A measure can have an effect in both the receipts and payments sections of BP2. In this case, the net impact of the measure can be found by summing up the impact in each year in each section.
Depending on the nature of the policy, particularly those where the financial impact is relevant for many years, the description may cover different time periods.
Other amounts included in the measure description may differ from those shown in the table. For example, they may include funding which:
-
has been redirected from another area, or
-
was included in a previous related budget measure and so is not a change in funding.
This funding would not show up in the budget tables, as these only show the net impact on the budget (an example of an ongoing program that also includes redirection in the measure description is below).
Industry, Science and Resources Portfolio
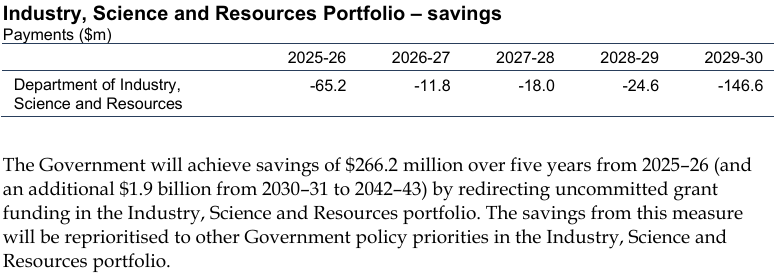
Source: BP2, Part 2: Payment Measures, page 122
Note: A positive number for receipts improves the underlying cash balance, while a positive number for payments worsens the underlying cash balance.
Government debt
Net debt is a key measure of the Government’s balance sheet and is often used as an indicator of the sustainability of the Government’s financial position.
How does the budget balance affect the Government’s debt position?
The Government’s debt position is affected by the amount spent or saved each year.
-
A deficit means the government will need to borrow to cover expenses, which will increase net debt. Additional debt will also increase interest payments in future years.
-
A surplus means the government can pay down debt, which will decrease interest payments in future years.
How is debt calculated?
The budget provides figures for both gross debt and net debt.
-
Gross debt shows what the government owes (its financial liabilities), but it does not include any of the government’s financial assets that offset its debt.
-
Net debt takes account of some of the government’s assets and is equal to gross debt minus a pool of liquid financial assets. Chart 3.12 of BP1, Statement 3 visualises net debt as a share of GDP.
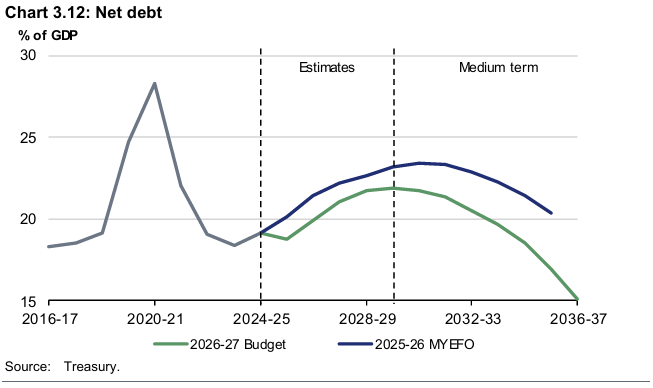
Source: BP1, Statement 3: Fiscal Strategy and Outlook, page 115
Do you need more information?
Detailed information on debt is available in Budget Paper 1, Statement 3, Statement 7, and Statement 10.
Time periods used in the Budget
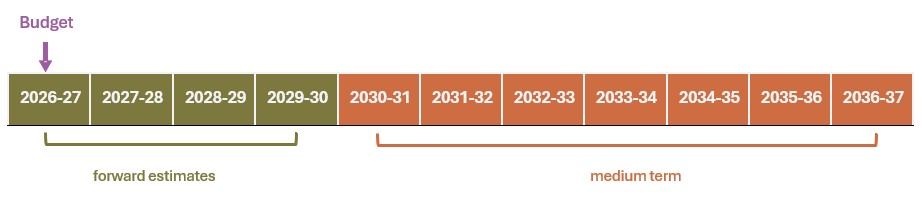
-
The budget year is the financial year covered by the Budget, which is 2026-27.
-
The forward estimates cover the budget year and the 3 years following, which are 2027‑28 to 2029-30.
-
The medium term is the 7 years following the forward estimates, which are 2030-31 to 2036-37.
For more explanations of key budget terms, see our Online Budget Glossary.
Want more information?
Some key resources to understand the Budget can be found here:
Explaination of key terms related to the Commonwealth Government budget in a non-technical way.